The principal scientific goal motivating the spectrograph design is to obtain in a single exposure 600 spectra of galaxies as faint as the spectroscopic limit of r'~ 18.2 over the three-degree field of the telescope. As always, the projected performance is the result of optimizing scientific return within cost and technology constraints. We will not explain the compromises (cf. the discussion in Chapter 1), but will describe the instruments as we are building them. We first outline the requirements driving the design; those that most directly affect it are resolution, wavelength coverage, number of fibers, and fiber diameter.
The spectral resolution is 2000, roughly where absorption lines in galaxies and quasars are resolved. Lower resolution reduces signal-to-noise by filling in the absorption with continuum light, higher resolution needlessly reduces spectral range, given that we can use at most two 2048² sensors to record the spectrum. Higher resolution also reduces the signal per pixel so that readout noise dominates for any but long exposures. The resolution we have chosen and the efficiencies we expect will give us shot-noise limited spectra almost everywhere in the bandpass with exposures as short as 20 minutes. A resolving power of 2000 is sufficient to distinguish velocities of 150 km/s in a single data element and is good enough to measure velocities to better than ± 20 km/s from an entire galaxy spectrum.
Placing the blue limit at 3900 Å ensures that the H and K lines of CaII are observed even at zero redshift. To observe H alpha to a redshift of z = 0.2 or more requires coverage to at least 8000 Å. Detector size suggests that going to 9100 Å is possible and appropriate, and the extra range is valuable for quasars.
To finish the survey in five years requires observing about 550 galaxies in each one hour exposure with efficiency good enough to do up to ten exposures on a single long night. Each field will also have between 50 and 100 quasar candidates plus a few fibers for the sky and the stars used for reddening, spectrophotometric calibration, and correcting for atmospheric absorption bands in the near infrared. The design comfortably accommodates 640 spectra per observation, using two spectrographs with sensors that are 2048 pixels wide.
For galaxies near our brightness limit, a 3 arcsec diameter aperture is a good compromise between collecting most of the galaxy light and rejecting the night sky. Fibers that preserve f/ratio and have excellent transmission over our wavelength range can be obtained in this diameter ( 180 µm). For galaxies near our faint limit, this diameter gives a galaxy flux comparable to the sky.
The telescope was designed with fiber spectroscopy in mind so it is hardly a constraint. The f/5 focal ratio is a good acceptance beam for optical fibers and the 2.5 m aperture is sufficient to measure faint galaxy redshifts in reasonable time. The aperture and f-ratio set the focal length and hence the physical diameter of the fibers. The required input aperture diameter, three arc seconds, corresponds to 0.18 mm at the focal plane.
The detectors are Tektronix 2048 x 2048 CCDs with square 24 µm pixels. The large pixels allow a modest demagnification ratio of 2.5 so the challenge is to put the full area of the detectors to good use. This requires a spectrograph camera with an exceptionally large field of view (16.5°) and the largest practical beam diameter (150 mm).
The final design is set after considering the science requirements, telescope, detector format, and operational considerations. The important characteristics are summarized here. Details appear in following sections.
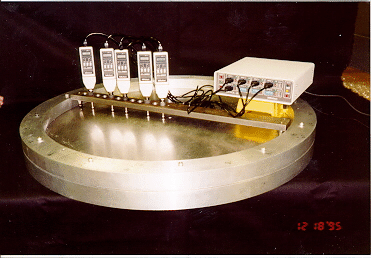
Measuring the profile of a fiber plug plate in a drilling template. The template deforms the plate to allow a standard 3-axis milling machine to produce hole axes aligned to the principal ray axis.
Fiber optics is the obvious way to do simultaneous spectroscopy of hundreds of faint galaxies. We will use custom drilled aluminum plug-plates to hold the fibers in the telescope focal plane (see Figure 7.1). These plug-plates will be installed in a fixture called a fiber cartridge and manually stuffed with fibers before nightfall. The fibers are brought to the slithead, which is incorporated in the cartridge and which mates with the spectrograph. During the night, up to ten cartridges will be swapped out to observe different fields.
In addition to the object fibers, which are single strands, there will be ten coherent fiber bundles capable of imaging a few arcseconds of the sky. These will be placed on preselected guide stars and feed a CCD camera mounted on one of the spectrographs. The guide stars will be used to center the telescope on the plug-plate field, adjust the plate scale of the telescope, control focus, and guide the exposure. One larger (30 arcsecond) bundle will be used to measure the sky brightness. Image quality and photometric data from these guide and sky bundles will be used to estimate the exposure time required to complete the observation.
The images of the fiber ends must be adequately sampled by the detector and be spaced sufficiently far to prevent crosstalk. Each fiber end ( 180 µm diameter) will just span three pixels ( 3 x 24 µm = 72 µm) with a spectrograph demagnification of 2.5. Placing the individual fibers at 360 µm intervals we might squeeze up to 340 spectra onto a single 2048 x 2048 CCD. In practice, packaging constraints limit us to 320 spectra per spectrograph and the fiber ends are spaced at 390 µm intervals. This is many fewer than the 600 or so needed to complete the survey in five years so we will use two identical instruments fed by a single plug-plate. With 320 fibers in each instrument, we get 640 spectra per exposure.
If a resolution element (the projected image of a fiber end) is three pixels across, then 2048 pixels cover 1700 Å in the visible at R = 2000 . To cover the desired spectral range of 3900-9100 Å at the desired resolution of 2000, we need more than 2048 pixels. Each spectrograph therefore has two detectors, one covering 3900-6100 Å and the other 5900-9100 Å. This gives the desired spectral range while approximating the R = 2000 requirement. The blue-red split is done with a dichroic coating on a beamsplitter, the blue side reflected and the red side transmitted.
To maximize efficiency, ten fiber cartridges, each loaded with a different plug-plate, will be ready to go at the beginning of the night. No nighttime plugging is required.
The spectrographs will be mounted on the telescope to maintain good fiber performance during and across exposures. Having captive fibers routed directly to a spectrograph on the telescope avoids repeated bending that would occur if the spectrographs were on the floor. The disadvantage is that the spectrographs must not flex as the telescope tracks.
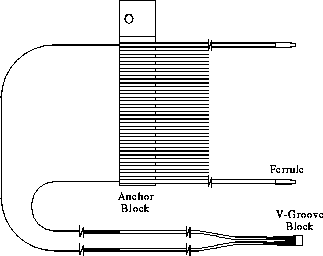
Fiber harness. Twenty fibers are terminated in the v-groove block at one end have ferrules at the other.
We are using silica UV-enhanced step-index fiber with a core diameter of 180 µm and a polyamide protective buffer. The spectrographs are mounted on the telescope, so each fiber need only be 2 m long. A sample set of fibers is shown in Figure 7.3. Each plug-plate has 640 fibers (plus approximately ten fiber bundles for acquisition and guiding), or 320 per spectrograph. Hence we require 6400 optical fibers plus spares to support ten plug-plate cartridges.
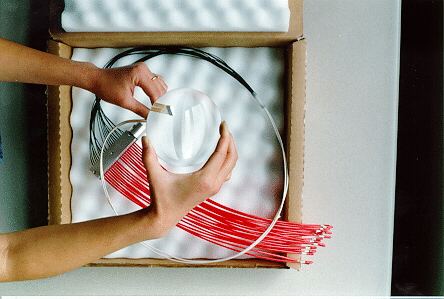
Prototype fiber optic cartridge with 20 fibers. The ends, which are plugged and unplugged during operations, are protected by tough nylon tubing. The lens enlarges the v-groove block termination at the slit end.
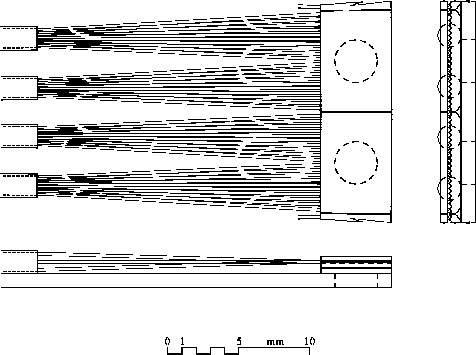
Detail showing v-groove blocks mounted to the slit.
At the slit, the fibers are separated by 390 µm center to center. The fiber outside diameter is only 220 µm, so there is insufficient room to individually terminate the fibers. Our two choices are to mount bare fibers to the slit or terminate the fibers in sets. Bare fibers are fragile and are difficult to polish flat and normal to the fiber axis. Mass-terminated fibers are robust and easily polished flat. We have chosen to terminate the fibers in v-groove blocks of 20 fibers. The resulting v-groove block is large enough to be handled easily, yet has few enough fibers that we can afford to replace a set if a few fibers break. We call a set of 20 fibers a "harness" (Figure 7.2).
At the plug-plate, each fiber is terminated in a stainless-steel ferrule. Jacketing on the fiber applies a torque to this ferrule, providing retention of the ferrule in the plug plate. This approach has been used successfully in many other plug-plate-based fiber spectrographs. Loss of light due to tilt of the ferrules in the holes is 0.3% or less. We achieve this by using high-precision ferrules and holes drilled with high precision spade drill bits held in a custom-made collet.
The fibers are supported below the plug plate by an anchor block. This block absorbs stresses induced by plugging and orients the fibers for maximum retention in the plug plate. Between the ferrule and the anchor block each fiber is encased in a loose-fitting jacket. The jacket protects the fiber from undue bending and applies sufficient torque to the ferrule to retain it in the plug plate.
Between the anchor block and the slit the fibers are not disturbed even during plugging, and so need not be heavily protected. In most of this region the fibers will be individually jacketed. Near the slit, the fibers will be encased in larger tubing, ten fibers to a tube, to assist in routing the fibers along the spectrograph slit.
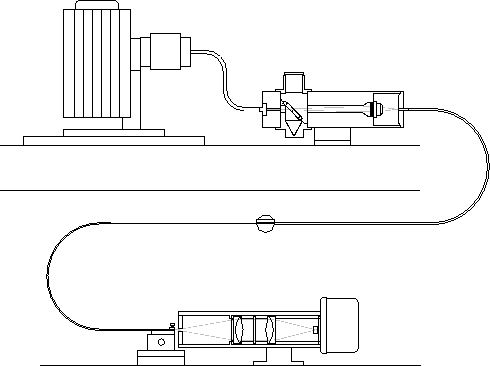
Fiber tester
At the spectrograph slit, the twenty fibers of the harness terminate in one custom-made stainless steel v-groove block (Figure 7.4). The grooves of the block are fanned out slightly in such a way that although the block is polished flat, the beam emitted by each fiber is normal to the slit.
We received and tested prototype harnesses from a number of vendors. These harnesses have adequate throughput and survive lifetime tests. The final vendor selection has been made and two complete sets of 640 fibers have been fabricated and tested.
We will install the fiber optic harnesses ourselves. The harnesses are attached at two points: the anchor block and the slit. The anchor block mounts to the plug-plate cartridge frame with a single bolt. The v-groove block is aligned by pressing the output edge against a curved alignment jig, and attached to the slit with an adhesive. An air-powered fluid dispenser meters the adhesive to prevent contamination of critical surfaces. A hole in the slit under each block allows removal of the block for replacement; a custom-made tool reaches through the hole to push the block off the slit, while simultaneously holding down the two neighboring blocks.
During manufacturing, each optical fiber will be tested for adequate throughput using the apparatus shown in Figure 7.5. White light from an intensity-stabilized quartz-halogen lamp is fed to the apparatus via a "source" optical fiber. The end of the source fiber is imaged onto the fiber under test using a microscope objective, which produces a uniform f/5 converging beam. A microscope eyepiece and pellicle beamsplitter give the user a view of the fiber under test.
Light from the output end of the test fiber is collected by a pair of achromatic doublets focussed onto a silicon photodiode. A filter between the doublets flattens the quartz-halogen spectral curve. A calibrated aperture blocks light outside a cone of f/4. A computer-controlled translation stage allows one to accurately locate the appropriate fiber of the v-groove block in front of the aperture. This same light collection system may also be used to measure light from the microscope objective, allowing us to make absolute throughput measurements.
We have constructed two fiber testers. The manufacturer uses one to measure every fiber and reject those found to have inadequate throughput, and we use the other to verify the manufacturer's measurements for some fraction of the fibers.
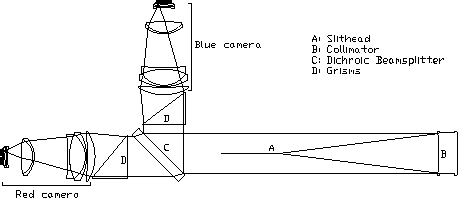
Spectrograph optical layout. The beamsplitter (C) transmits longward of 6000 Å.
The spectrograph optical layout is shown in Figure 7.6. Light from the fiber optics (A) exits in an f/4 beam, expanded somewhat from the f/5 input beam of the telescope due to processes collectively known as focal ratio degradation. The beam encounters the spherical collimator mirror (B) and collimated light returns in a 150 mm diameter beam, passes the slit, and meets the dichroic beamsplitter (C). The blue light ( < 6000 Å) is reflected while the red light is transmitted. Past the beamsplitter, the light encounters the dispersing grism (D). The dispersed light exits the grism and meets the wide field f/1.3 240 mm camera that images the spectra onto the Tektronix 2048 x 2048 CCD. Optical details of these components are described here. Mechanical details are in the following section.
The fiber slit is 4.9 inches long, packed with 320 fibers. The obvious collimator design to use with this long slit is a Schmidt. The Schmidt is inexpensive to manufacture, has the required field of view (6°), and uses a mirror, which makes the instrument compact.
Although we explored a classical Schmidt design, we found it possible to eliminate the corrector plate because our imaging requirements did not need the full Schmidt performance and some of the deficit due to the missing correctors could be compensated in the spectrograph cameras. Thus, our final collimator design is a single mirror with a spherical figure. The mirror is rectangular, 7 x 17 inches, with a 49.8 inch radius of curvature. The substrate is a slumped borosilicate gas fusion blank made by Hextek.
We examined alternatives to the Hextek blank including aluminum, eggcrate Zerodur, and monoliths. The gas fusion blank wins easily on weight and cost considerations. The compromise is in the thermal coefficient of expansion, which is non-zero but smaller than aluminum. An aluminum mirror would obviate the need to refocus when the temperature changes, but is expensive and the coatings are fragile. An eggcrate Zerodur mirror is immune to large temperature changes but is expensive and would require the most refocusing. A monolith would work well enough, but would not be significantly less expensive than the lighter and more thermally responsive gas fusion mirror.
An enhanced silver coating will be placed on the mirror for better than 95% reflectivity throughout our wavelength range.
The beamsplitter, which divides the collimated beam into red and blue channels, is made of fused silica. This material has excellent transmission and low dispersion in our wavelength range. It is thick, 1.5 inches, because the reflecting surface is a mirror and needs to maintain a flat figure.
The dichroic coating is efficient in reflection (98%), reasonably good in transmission (94%), and has a narrow 200 Å crossover range.
The dispersing elements are grisms with zero angular deviation at 4960 Å for the blue and 7400 Å for the red. In our case, these are right angle prisms with a transmission grating replicated on the hypotenuse. While a reflection grating might have been used, the grism permits mounting the cameras close to the system pupil, which is about midway on the grating. With a reflection grating, the cameras have to be mounted away from the grating to avoid interference with the incoming beam, making them larger and more difficult to design. A plane transmission grating does not work because the diffracted angle is large, making geometric losses high (the groove facets are foreshortened) and forcing the blaze peak outside the optical band. Our configuration has little groove shadowing or foreshortening and results in high grating efficiency.
The ruling densities are 640 and 440 lines/mm for the blue and red grisms, respectively. Because master rulings of the size and groove angle needed did not exist, new masters were ruled.
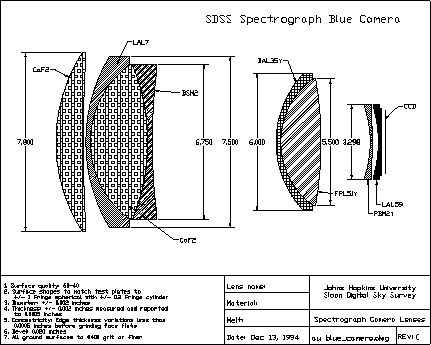
Spectrograph camera designed by Harland Epps. Diameters are in inches. The asphere is on the air surface of the FPL51Y lens.
The spectrograph camera is an all-transmission design because the fiber optics generate a filled beam. The usual practice of hiding the detector or a secondary mirror in the center of the beam (as in a Schmidt camera) cannot be used without unacceptable light loss.
The cameras are the biggest technical challenge in the spectrograph. An f/1.3 camera with 240 mm focal length and 16.5° field of view capable of using 24 µm pixels cannot be purchased off the shelf. On the other hand, cameras with similar performance are now being built primarily because of the availability of Tektronix 2048 CCDs with 24 µm pixels and the popularity of fiber spectrographs.
We considered modifying an existing design and examined the KPNO Bench Spectrograph Camera (by George Simmons), the VLT spectrograph cameras (Hans Dekker et al.), and the LRIS and Norris spectrograph cameras (Harland Epps). All are Petzval lenses with two widely spaced, approximately equal powered components. None provided the performance needed.
We chose to contract Harland Epps (UCSC) to design new cameras for our spectrographs, shown in Figure 7.7. The result is similar to the LRIS design but has a smaller diameter and larger field of view. All but one of the surfaces are spherical and the asphere is relatively mild.
The CCD detectors are thinned Tektronix 2048 x 2048 with square 24 µm pixels. Readout noise is 5 electrons, full well is 150,000 electrons. Their remarkable characteristic is a high quantum efficiency in the blue spectral region (see Figure 7.9).
Table 7.1 shows the spectrograph optical prescription. Some of the surface descriptions can be deciphered from this example: "Doublet,first,back" refers to the doublet component, first lens element, back surface (closest to the CCD). The "Radius" is the radius of curvature in inches, negative implying a concave left surface. "Thickness" is the distance from the current surface to the next; positive to the right. All materials are from Ohara Glass except for CaF2 and the lens couplant, Dow-Corning Q2-3067.
| Surface | Radius (inches) | Thickness (inches) | Material |
|---|---|---|---|
| slithead | -25.2 | 24.803 | air |
| collimator mirror | -49.760 | -47.328 | air |
| prism (37°) | flat | 2.543 | BK7 |
| grating | flat | 2.070 | air |
| singlet,front | -7.196 | -1.202 | CaF2 |
| singlet,back | -71.400 | -0.100 | air |
| triplet,first,front | -7.306 | -0.203 | LAL7 |
| triplet,first,back | -4.168 | -0.003 | Q2-3067 |
| triplet,second,front | -4.168 | -2.501 | CaF2 |
| triplet,second,back | 8.903 | -0.003 | Q2-3067 |
| triplet,third,front | 8.904 | -0.201 | BSM2 |
| triplet,third,back | -26.042 | -5.391 | air |
| doublet,first,front | -4.350 | -0.200 | BAL35Y |
| doublet,first,back | -3.436 | -0.003 | Q2-3067 |
| doublet,second,front | -3.437 | -1.737 | FPL51Y |
| doublet,second,back | 16.915 (asphere) | -2.104 | air |
| flattener,first,front | 5.323 | -0.080 | PBM2Y |
| flattener,first,back | 29.111 | -0.332 | air |
| flattener,second,front | 4.832 | -0.15 | LAL59 |
| flattener,second,back | flat | -0.144 | air |
| CCD | -91.399 | 0 |
The spectrograph sensitivity is controlled by the grating throughput and the CCD quantum efficiency. We are fortunate to have excellent blue response in the CCDs. Figure 7.8 shows the throughput estimate. This is for photons falling within the 3 arcsec fiber input aperture and does not include losses at the telescope mirror coatings or light that misses the fiber. Figure 7.9 shows the detail efficiencies of the spectrograph components.
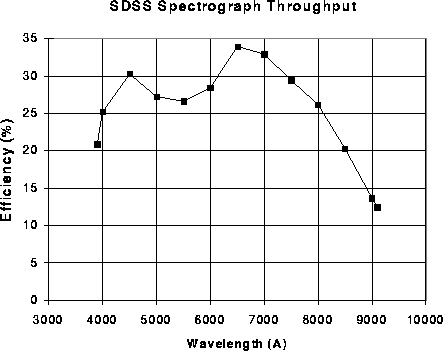
Spectrograph throughput. This calculation excludes telescope losses.
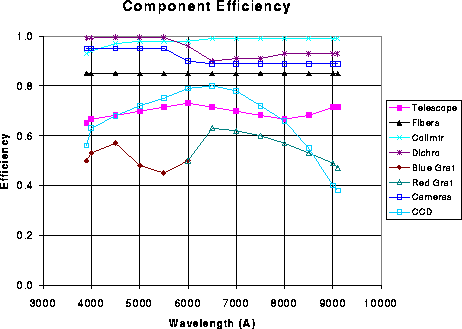
Spectrograph component efficiencies.
Although the input apertures cover three pixels on the detector, we need better resolution in the optical system to minimize crosstalk and improve signal-to-noise. The spectrograph optical design meets this goal nicely, producing rms spot diameters about the size of a pixel and resulting in nearly zero crosstalk from adjacent fibers. Table 7.2 shows rms spot diameters over the field of the blue CCD. The red performance is similar. The wavelengths (in A) are listed along the top and the slit position, measured in mm from the slit center, along the left. The slits are 4.9 inches high so the 60 mm field position is near the end of the slit, which is imaged along the edge of the chip. The wavelength coverage in the blue channel is 3900-6100 A so the table covers one half the area of the CCD. Performance is excellent over most of the chip. The r.m.s. spot diameters are about the size of a single pixel.
| Slit Position (mm) | 3900 | 4000 | 5000 | 6000 | 6100 |
|---|---|---|---|---|---|
| 0 | 20 | 17 | 24 | 21 | 22 |
| 10 | 20 | 17 | 24 | 21 | 22 |
| 20 | 20 | 17 | 23 | 21 | 22 |
| 30 | 21 | 17 | 21 | 22 | 23 |
| 40 | 21 | 18 | 20 | 22 | 23 |
| 50 | 21 | 18 | 19 | 23 | 24 |
| 60 | 22 | 20 | 20 | 24 | 27 |
Scattered light is a notorious problem for straight-through spectrograph designs and we do not anticipate perfection here. The gratings will probably be the primary source of scattered light and unfortunately, there is little we can do to control this. We will minimize the problem by careful attention to baffling and cleanliness; note that the instrument need never be opened to the outside atmosphere during normal operation. The interior will be purged with dry nitrogen, preventing condensation and mineral deposition, and the gas used on all actuators will be exhausted to the exterior.
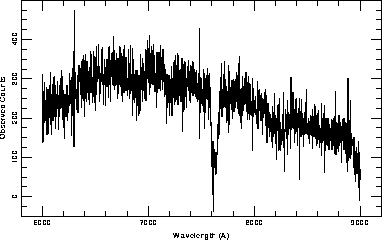
(first part of two-part figure) detected electrons with the averaged sky emission from three fibers subtracted for a g'=19.8 spiral galaxy at a redshift of 0.20.
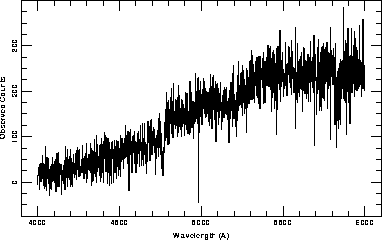
Simulated spectra. Spectra are shown for the red and blue detectors in A simulated sky-subtracted but otherwise raw spectrum of a g'=19.8 spiral galaxy at z=0.2 with this system is shown in Figure 7.10; the top panel shows the blue half and the bottom the red. The H and K lines of CaII, the G band, the magnesium feature, and the sodium D lines are all clearly seen in absorption in this simulated spectrum of a galaxy considerably fainter than the survey limit.
The telescope optical system is a simple, fast, large field design with a focal surface flat to 2.6 mm but one where the principal ray deviates from the normal to the best-focus surface by up to 37 milliradians. For highest efficiency, the ends of the optical fibers should be positioned on the best-focus surface with their axes aligned with the principal ray. It turns out that plug-plate technology can be made to satisfy these criteria quite nicely.
The plug-plates will be aluminum alloy 2024-T3, 3.2 mm thick and 0.813 m in diameter. By applying bending moments to the edge of the plate (beyond the field of view), finite element calculations show that it can be deformed to match the best-focus surface to an area-weighted 62 microns r.m.s. The greatest departure from the best-focus surface is 200 microns and occurs at the center where the images are the best. Overall, the images are not significantly degraded from the best-focus surface.
As deformed to match the best-focus surface, the hole axes should line up with the principal ray axes. This is straightforward to accomplish if the plug-plate is deformed (in the opposite sense) over a properly curved mandrel, for drilling. If this is done, the drilling can be performed using a three-axis Computer Numerically Controlled (CNC) milling machine, i.e., it is not necessary to tilt the drilling head or the plug-plate.
Drill test results indicate that holes can be drilled with an accuracy of 9 microns r.m.s. in position and 4 microns standard deviation in diameter using short high-precision spade drill bits in a custom-made collet. In the test, four different bits were used to drill 50 holes each. The drilling time was 5.8 sec/hole. No significant degradation in drilling accuracy was observed for a range of slopes in the work-piece surface from 0 to 70 milliradians.
The plug-plates have a mass of only 4.3 kg. The plug-plates are thin enough so that the bending stresses, forces and material costs are reasonable. They are thick enough to provide hole depth adequate to constrain the plug angular alignment with the hole and to prevent significant gravity-induced deflections.
The fiber cartridge consists of a frame that supports the optical fiber harnesses, spectrograph slithead, and plug-plate holder (see Figure 7.11). The plug-plate holder consists of two large rings that warp the plug-plate to match the telescope best-focus surface. The upper ring includes a kinematic interface to the telescope to allow repeatable positioning of the cartridge on the telescope. By assembling the components into a cartridge, they can be handled as a unit, thereby reducing the complexity of the plug-plate changing operation. In particular, this approach addresses the following issues:
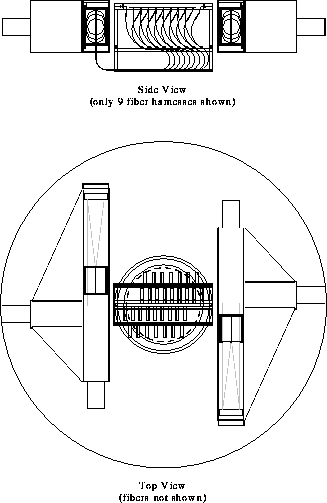
Fiber Cartridges shown with spectrographs. The large circle is the outline of the instrument rotator.
Ten cartridges are planned, enough so that plugging need not overlap observations except on the longest, darkest and clearest nights. This, in turn, allows plugging to be performed by day-shift personnel, is likely to result in higher reliability and better staff utilization, allows some work-load leveling, and allows time for the cartridges to thermalize completely between plugging and observing.
During the day, for each cartridge that was used successfully the previous night, the plug-plate will be unplugged and removed and an unused plug-plate will be installed and plugged. On average, over the life of the survey, about two cartridges per day will need new plug-plates. Our experiments with a mockup and the experience of other groups with operating systems indicate that this will take about two person-hours per cartridge (Limmongkol et al. 1993). Since a full time equivalent (FTE) employee works only about 4.8 hours per day averaged over all the days in the year, the labor requirement is about 83% of a FTE, and the operating cost is quite acceptable. Unfortunately, the work-load is expected to be very uneven, peaking during dark time in February.
While staffing for this task is likely to evolve, we expect to initially hire two people with primary responsibility for plugging, with secondary responsibilities to survey and observatory operations. Other members of the observatory staff will assist, as needed, in plate changing during peak load periods.
The correspondence of fibers to the holes in the plug-plate is determined by a device called the plug plate mapper, which illuminates each fiber sequentially from the spectrograph ends. The illuminated fiber will appear as a bright point against a dark background. A CCD camera will be used to determine the location of each fiber and to verify its position and throughput. This is a function of the plugging station, occurs unattended, and should require about 5 minutes.
All cartridge operations occur at the same level, i.e., the telescope platform and the adjacent support building. The cartridges are assembled in the plugging room of the support building. They are stored in a space with doors to both the plugging room and the outside. At night, the outside door is opened to allow the cartridges to equilibrate to the temperature of the ambient air. Each cartridge, before use, is moved on a cart to a holding area near the telescope, where further equilibration occurs. The telescope is pointed to the zenith for removal or installation of cartridges. An empty cart is rolled under the cartridge to be removed. A lifting mechanism built into the fork base lifts the cart into contact with the cartridge so that the cart is supporting the weight of the cartridge. The cartridge is detached from the instrument rotator and the cart/cartridge assembly is lowered to the fork base. The procedure is reversed to install the new cartridge. Locating surfaces and sockets guide the cart and cartridge into the proper orientation with respect to the telescope.
As the cartridge is lifted into place and clamped to the telescope, the slitheads are simultaneously inserted into sockets in the spectrographs. The slitheads are attached to the cartridge frame by stiff springs so that they can move slightly with respect to the rest of the cartridge. Once the cartridge has been correctly positioned and clamped to the telescope, the slitheads are loaded against three point kinematic mounts on the spectrographs by pneumatic clamps. Each slithead will be coded and its identification relayed to the observer's workstation when it is inserted. This allows adjustments for each slithead, e.g., image placement on the CCD and focus, to be made automatically.
The optical bench maintains the optical alignment. Figure 7.12 shows how the major optical components are attached to the optical bench, which is the large boxy piece in the center.
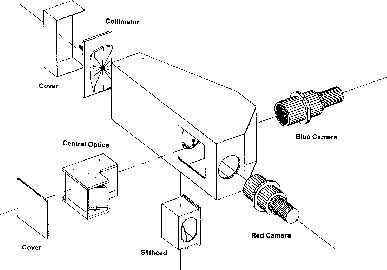
Parts of the spectrograph.
The final product is shown in Figure 7.13. The structure was welded, stress relieved, heat treated and painted.
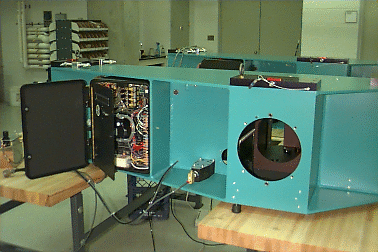
Optical bench. The large hole will hold the blue camera. Electronics are seen on the left and the small box near the bottom center is the slithead pneumatic clamp.
Because the spectrographs are mounted on the telescope, low flexure is important. We will allow up to 1/10 pixel flexure at the CCD due to the optical bench during any one hour exposure.
A finite element engineering model of the optical bench was used to examine the flexure properties and tune the design. Our requirement of 1/10 pixel flexure due to the optical bench in a one hour exposure was met by a box made of 1/4 inch thick aluminum with internal reinforcements and an optimized mounting system. Figure 7.14 shows the flexure performance. In this test, the instrument was rotated about its long axis and the position of a spot in an off-axis corner of the CCD was observed. Figure 7.14 shows the spot position with the spectrograph rotated 60° and turning to -60° at 15° intervals. The worst case movement through 15° (or a one hour exposure) is considerably less than 1/10 pixel.
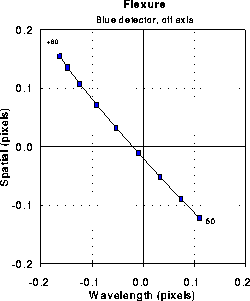
Flexure performance of the optical bench.
Because the telescope focal plane is coupled to the spectrograph through flexible optical fibers, there is no need to fix the spectrograph rigidly to the telescope. Instead, mounting fixtures that accommodate the different coefficients of thermal expansion of the steel used in the telescope and the aluminum of the spectrograph will be used.
The slitheads are latched into three point kinematic mounts on the spectrographs and are held in place by pneumatic clamps. Each slithead will be coded and its identification relayed to the observer's workstation when it is inserted. This allows slithead-specific adjustments, image placement on the CCD and focus, to be made.
The spectrograph focus will be determined using the usual Hartmann test. Pneumatically actuated collimator masks take the form of "saloon doors" located immediately in front of the collimator (these are not shown in Figure 7.6).
Focus adjustment is required because of the expansion and contraction of the aluminum optical bench, which moves the slithead relative to the collimator mirror. By moving the collimator to compensate, we keep the slithead in focus. Temperature sensors will allow us to read the focus value from a table after initial measurements are made. Each slithead is expected to have a slightly different zero-point focus because of manufacturing variations, so each will be encoded to allow adjustment for personality.
The collimator mount is complex. The collimator must move in and out (piston) to correct for expansion and contraction of the aluminum optical bench due to changing temperature. It must also pitch and yaw with one arcsec precision to allow widening the flat field spectra and positioning the spectra correctly on the CCD. Small variations between slitheads require the ability to position accurately the image on the CCD to avoid, for example, a bad pixel. These motions, which we would like to control to 1/10 pixel, require linear resolution of one or two microns.
Our design uses three DC servo motors at the mirror mounting points driven by an external controller (motors and controller by Physik Instrumente). A small control computer on the spectrograph commands the motors through an RS232 link to the motor controller board.
The central optics include the dichroic beamsplitter and the grisms. Each optic is set in a six-point kinematic mount and the cell, in turn, is fixed in a three-point mount within the spectrograph optical bench. Alignment is achieved with tight machining tolerances and custom machined inserts so no screw adjustments will be necessary.
The camera lens cells and housing are adapted directly from Michael Carr's similar, but larger, LRIS and Norris spectrograph cameras. The cells follow conventional optical mounting practices except in the radial supports of the large lenses. Here, six precision machined inserts of glass-filled Teflon center the lenses on the optical axis. The more common practice of building a mold of rtv around the lenses has the disadvantage of not being able to disassemble the camera easily. Figure 7.15 shows the concept.
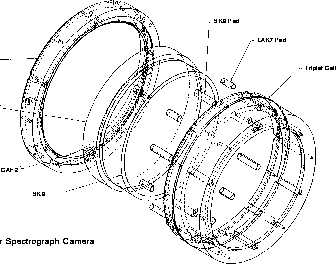
Triplet element lens cell.
We have assembled one camera (Figure 7.16). Initial tests show that its optical performance is exactly as predicted by the raytrace.
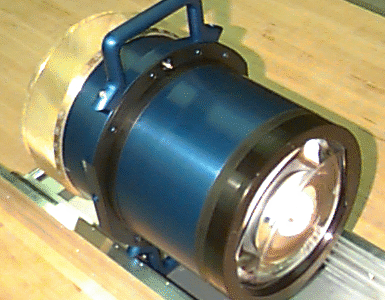
Spectrograph camera
The shutter is located immediately in front of the central optics. Because timing resolution is not critical, we will actuate the shutters pneumatically, opening or closing them within about 300 ms.
A manual focus mechanism moves the dewars (plus field flatteners) with respect to the cameras. This adjustment is suitable for initial camera setup (to correct for red/blue camera differences) and to accommodate focus changes that might be necessary because of detector replacements. Note that because the cameras are designed to be parfocal over our operating temperature range, routine focus of the spectrographs can be done by adjusting the collimator.
The CCDs are mounted in custom dewars using the same ball and socket adjustment fixture found in the photometric camera. The dewars can be physically small because they use an autofill liquid nitrogen system and do not need a large capacity.
All spectrograph operations are controlled from a single program running on the observer's workstation. This program, the observer's sole interface to the spectrographic system, is a clearinghouse for observing commands that translates observer's requests into the commands required by the independent subsystems used for spectroscopy. These systems include:
The spectrograph mechanical operations will be controlled by Z-World Little Giant Z180 microprocessors, one on each spectrograph. The board was chosen because it is programmable in C and has the right number and type of I/O ports and A/D converters. They communicate with the observer's program through an RS-232A serial port. The processor controls all the mechanical functions on the spectrograph (shutters, Hartmann masks, collimator tip, tilt, and focus) and monitors ambient and instrument temperatures for use in adjusting focus and image positioning.
The observer's software communicates fully with the telescope control system via an Ethernet telnet connection. One might imagine that when a new plug-plate is locked on the telescope, the spectrograph relays the plug-plate ID to the observer's software, which looks up the coordinates in the plug-plate database. The observer's software commands the telescope to move to the mid HA position for flat field and wavelength calibration, then to the field for precise positioning, scaling, and focusing. When these operations are finished, the observer's software starts the guider, opens the shutters, and begins observing.
The data acquisition hardware for the spectrograph CCDs is a clone of the photometric camera system. The observer's program actuates the system through remote procedure calls (RPC) over the Ethernet. The commands are few and simple, only those required to prep the CCD, expose, and read out the data. Once the data are off the chips and in the data system buffer, the images will be downloaded over a high speed VME link to the observer's workstation where they will be written to disk. At the end of the night, a tape is written and sent to Fermilab.
The drilling database is the list of objects on a plug-plate. It includes the name and drilling coordinates of each object and the field coordinates ( alpha , delta , equinox) of the plug-plate. This information is needed at observing time so the telescope can be pointed and the plug-plate ID can be incorporated into the data file. This database is generated at Fermilab from the photometric imaging data and is delivered on the internet to the observer's workstation at Apache Point well before the observations.
To keep track of which fiber went into which plug-plate hole, the plugging station will be equipped with a device to map the plug-plate locations to the slithead after plugging is finished. The plugging database information is written directly to the observer's workstation disk at plug time. This information is merged with the CCD data before it is written to disk.
For the calibration observations, a white screen is drawn across the top of the telescope. The screen is illuminated by calibration lamps mounted on the telescope structure. Flat field exposures will probably be of two kinds: one is designed to correct for detailed pixel-to-pixel variations on the detectors. These will be taken with the collimator mirror nodding slightly (to move the image a few fiber diameters perpendicular to the dispersion direction) in order to uniformly illuminate the detector. The others, which might even be binned vertically (the dispersion direction) during readout, will not be nodded and are intended to calibrate the fiber throughput as a function of wavelength. Both flat-field and calibration exposures will be read in "quick" mode with reduced sample times (but with the CCD transfer timing the same as for normal readout) to reduce the readout time to 30 seconds.
After the calibration exposures, the telescope is moved to the field. Ten coherent fiber bundles feed images of setup stars to a television camera mounted on the spectrograph. These setup stars are used to center the field on the plug-plate, adjust the scale of the telescope (by simultaneously adjusting the primary and secondary mirrors), and set the telescope focus. Once these operations are automatically done, the guider is started. A series of four short (1 minute) exposures with the telescope offset 1.5 arcseconds in each direction in altitude and azimuth build up a 2 x 2 raster of the plug-plate field. These exposures will be binned heavily in the dispersion direction on readout; the data will be used to check for systematic errors in the drilling system and provide spectrophotometric calibration information. Next, three nominally 15 minute exposures make up the primary spectroscopic observation. Three exposures allow efficient cosmic ray discrimination, though it is possible that sufficiently powerful software will work well with two or even one; we will pursue this issue during the test year.
The sky brightness will be monitored with a guide camera through a wide-field (30 arcsecond) fiber bundle placed at a blank location in the field. This information, combined with the transparency and seeing data available from the ten guide stars will allow us to control precisely the exposure time needed to achieve the desired signal to noise ratio. The exposure times will be adjusted for atmospheric extinction, sky brightness, and galactic extinction with the aim of producing insofar as possible a uniform limit to the survey outside the galaxy; the range in exposure times is close to a factor of two.
Thus the sequence (with estimated timings) is as follows, starting with the telescope at the zenith between exposures, and assuming that the previous exposure has just ended:
At the end of the series of observations, the data are collected, merged with the database information that identify the field, plug-plate, and fiber assignments, and written to disk. At the end of the night, all of the data are written to a DLT tape and shipped to Fermilab.
Limmongkol, S., Owen, R.E., Siegmund, W.A., and Hull, C.L., 1993, ASP Conference Series, Volume 37, Fiber Optics in Astronomy II, (BYU: Provo, UT), 127.