If galaxies were randomly distributed on the sky with a surface density of 100 galaxies per square degree, then each 3° circular field would be expected to contain 707 +- 27 galaxies. In fact galaxies are considerably more clustered than this, and many fields contain many more galaxies than we have fibers. While such fields could be repeated to obtain the remaining redshifts, the time overhead would be prohibitive, close to 60%. Therefore, instead of using a uniform grid of field centers which uniformly covers (`tiles') the sky, we plan to use adaptive tiling, in which the field centers are moved more closely together in regions of high galaxy density to provide greater coverage of these regions. It would obviously be desirable to arrange the plates in such a way that all density enhancements lay in the areas where many fields overlapped. In addition, if it could also be arranged that all pairs of galaxies closer than 55" , the limit set by the fiber size, were in the overlap regions, we would be able to circumvent this limit. In the following we will speak of the 3° fields as "fiber plates" or simply "plates."
In one dimension the optimization problem is trivial, but in two (or more) dimensions it may be shown to be NP-complete (which means for our purposes that there is almost certainly no efficient algorithm for solving it exactly, although there may be good approximate methods). We approached the problem by first solving the plate-assignment problem for given plate centers, in itself a non-trivial problem, and then generalizing our solution to find a near-optimal set of field centers.
The plates are circular and hence overlap; thus if one is given a set of fiber plate positions many of the galaxies will appear in the regions where two or more plates overlap, and for each of these galaxies one must decide in which plate to take its spectrum. Because one is using a fixed number of fibers such decisions can affect the total number of spectra that we can obtain with a given number of exposures ("If I take this spectrum with plate A that frees up a fiber in plate B, so I can deal with that galaxy in plate B not plate C, so ...").

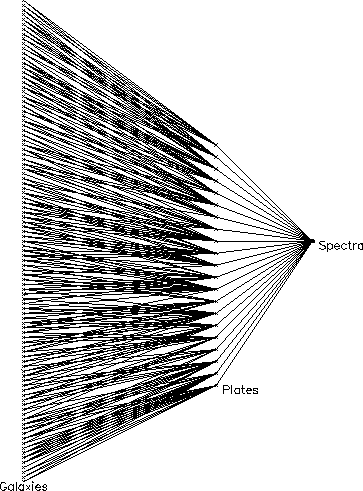
How the tiling problem maps onto a network flow. The leftmost column of crosses represents the galaxies, and each is connected to the one or more plates in which they lie. Each of these lines has a flow capacity of 1. Each plate is connected to a point labeled `Spectra'; each of these lines has a capacity equal to the number of galaxy and QSO spectra that we can take at a time, approximately 610 in the real survey.
This problem can be reduced to a network flow problem (e.g. Papadimitriou and Steiglitz, 1982) and solved efficiently in polynomial time. The construction consists of noticing that each galaxy can be thought of as a source for 1 unit of flow of some fictitious fluid, and that each plate can be thought of as a pipe that allows no more than n units of flow (where n is the number of galaxies per plate). Each galaxy is attached to each plate that it lies in (see Figure 8.1); if we can find a flow pattern that satisfies our constraints we have solved the problem. Fortunately such flows constitute a well-studied field of computer science and good algorithms exist for solving them in a time that scales as some low power of the number of plates (or, more precisely, the number of regions defined by the overlap of two or more plates).

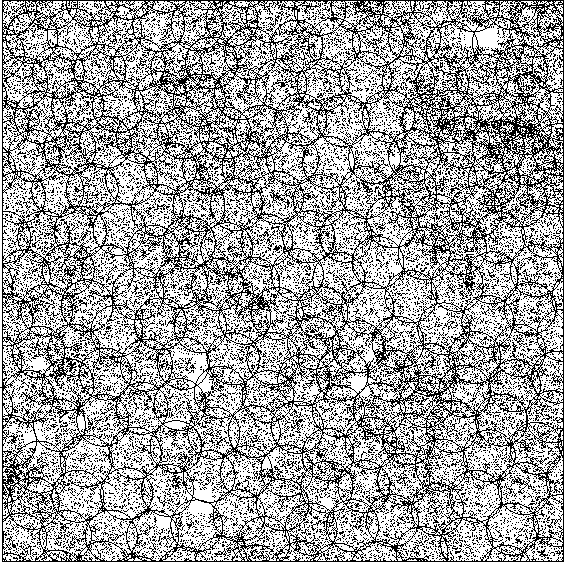
The distribution of plates after running the adaptive tiling algorithm. This run used test data consisting of galaxies from the APM Galaxy Survey and QSO candidates distributed at random. Out of 365,931 targets, 365,711 are successfully assigned to 651 plates, each of radius 1.5° and capable of taking 610 spectra. This plot shows just the central 36° x 36° area. The blank regions are holes drilled out around bright stars.
In order to test our implementation of the flow problem, we have generated a test data set of 365,931 galaxy and QSO targets covering an area of sky of solid angle 1 steradian (just under a third of the area of the northern survey). The galaxies were selected from the APM Galaxy Survey (Maddox et al. 1990) and so reflect true clustering in the Universe. QSO candidates were generated at random, and comprise 15% of the targets. Each spectroscopic plate is capable of taking 640 spectra. Thirty fibers per plate are reserved for sky and for standard stars, leaving 610 fibers per plate for scientific use. Ignoring for the moment the fact that we cannot observe both members of a pair of galaxies closer than the minimum fiber spacing on one plate, using a near uniform covering of 651 plates enables 97.2% of targets to be observed. The remaining 2.8% of unobserved targets are far from randomly distributed and so would significantly bias measures of galaxy clustering. One can observe 99.5% of targets by increasing the number of plates to 770, but this is an additional overhead of almost 20%. Scaled to the SDSS area of pi steradians, this represents a year of operation and roughly three million dollars.
It has seemed to us that if we use only slightly more than the minimum number of plates, but allow the centers to move in such a way that we can have a higher density of plates locally to cope with high density regions, we might be able to do better.
In the network flow problem described above, we have no way of telling which perturbations of the plate centers would help and which hinder, but a slight modification of the flow problem provides this information; instead of assigning each galaxy to the set of plates in which it lies, assign it to all plates (or at least all the nearby ones), with an associated cost which increases sharply as the galaxy moves away from the plate. Then instead of solving the simple network flow problem, find the flow with the lowest total cost; again this is a standard problem in computer science and good solutions exist. We now know which galaxies are forced to be assigned to distant plates, so we can rearrange the plates accordingly and iterate towards a solution.
Starting with the uniform cover of 651 plates, the adaptive tiling code soon converged to a solution whereby 99.9% of targets were assigned a fiber; the resulting distribution of plate centers is shown in Figure 8.2. In practice, the observing strategy of interleaving photometry and spectroscopy will present us not with large, square areas for tiling, but with long, narrow regions elongated in the scan direction. We have investigated the effects of this by tiling the test data in a series of 10° wide regions. In order to minimize edge effects, we do not drill plates which extend over an internal boundary between tiling regions, but include the untiled targets left over from one run of the tiling code with the succeeding run. We lose a little efficiency ( ~ 5% ) by tiling in sub-regions, but this is still much more efficient than using a fixed tiling pattern.
In the plug-plate scheme, the plugs which hold the fibers will be 3.2 mm in diameter, which projects to 55 arcseconds on the sky. This clearly represents the minimum fiber separation; it corresponds to a distance of about 100 kpc (H0100)-1 at the survey limit of about z=0.2 . If the galaxies were randomly distributed, the probability of another fiber plug overlapping a given one is about 3%; this is increased to about 7% on average by the correlations in the counts to this limit. Most of the objects lost are members of binaries. The losses are worse in the densest regions, such as the centers of rich clusters at intermediate distances.
These losses do not affect subsequent large scale structure studies, because if we are unable to target both galaxies of all close pairs we must remove all such pairs from the analysis. However, there are other problems, most particularly the dynamics of binary galaxies and the study of subclustering and velocity dispersions in rich clusters for which this minimum separation is a real hindrance. It is important to note, however, that more than 40% of the sky is covered by two or more plates. In these overlap regions, we can observe nearly all pairs of galaxies closer than the minimum fiber separation by assigning each galaxy to a different plate. Currently, this re-allocation of fibers to close pairs in overlap regions is carried out by a process which runs after the adaptive tiling, and enables us to observe 95.6% of targets. We are in the process of incorporating the minimum fiber spacing constraint into the tiling algorithm itself, which will hopefully allow us to observe an even higher fraction of galaxies in close pairs by placing plate overlaps in regions where there is a high density of close pairs.
Maddox, S.J., Sutherland, W.J. Efstathiou, G., and Loveday, J., 1990, MNRAS 243, 692.
Papadimitriou, C., and Steiglitz, K., 1982, Combinatorial Optimization, Algorithms, and Complexity, Prentice Hall.