Rayleigh-Taylor Instability Test |
"Hydrodynamic and Hydromagnetic Stability", by S. Chandrasekhar, sections 92 and 97 cover the hydrodynamic and MHD linear stability problems respectively. The nonlinear regime is studied in, for example, "A numerical study of Rayleigh-Taylor instability in magnetic fluids", by Jun, Norman, & Stone, ApJ 453, 332 (1995), and in section 4.6 in Liska, R., & Wendroff, B., "Comparison of Several difference schemes on 1D and 2D Test problems for the Euler equations", available on the web.
For the single-mode test, we use a rectangular domain, -0.25 ≤ x ≤ 0.25; -0.75 ≤ y ≤ 0.75. The boundary conditions are periodic at |x| = 0.25, and reflecting walls at |y| = 0.75. For y>0 the density is 2.0, while for y ≤ 0 it is one. A constant gravitational acceleration g = 0.1 must be added to the equations of motion. The pressure is given by the condition of hydrostatic equilibrium, that is P = P0 - 0.1ρy, where P0=2.5, and γ = 1.4. This gives a sound speed of 3.5 in the low density medium at the interface.
The structures which appear in the nonlinear regime are very sensitive to the nature of the perturbations used to seed the intability. To avoid gridding errors associated with perturbing the interface, we instead perturb the velocities. For the single-mode perturbation, we set Vy = 0.01[1 + cos(4πx)][1 + cos(3πy)]/4.
For the multimode perturbation, we use a domain of size -0.25 ≤ x ≤ 0.25; -0.375 ≤ y ≤ 0.375, and set Vy = A[1 + cos(8πy/3)]/2, where A is a random number at each zone with a peak-to-peak amplitude of 0.01.The way in which source terms are included in the algorithm can have a strong effect on the outcome of this test. For example, for Godunov schemes, if the source term is added using operator splitting, grid noise generated by the lack of an exact numerical equilibrium can perturb the interface and seed structure. In Athena, the source terms are included directly in the reconstruction and integration steps, so that it is able to hold hydrostatic equilibria quietly without the complexities suggested by Zingale et al. (ApJS, 143, 539, 2002).
At early times, one can check that the growth rate of the vertical component of the velocity agrees with the prediction from linear theory.
At late times, once the instability has gone fully nonlinear, it is difficult to make quantitative comparisons. However, the sharpness of the boundary between the two fluids is an indication of the numerical diffusion of the scheme. Also, the amount of fine scale struture induced by secondary KH instabilities is sensitive to the way the interface is perturbed, and how sharp the algorithm preserves the contact discontinuity. It is not always clear that sharper is better, however. For example the "contact steepener" in the PPM algorithm can introduce "stair stepping" in contact discontinuities in multidimensions, which in turn can cause KH rolls to be seeded by grid noise. We do not use the contact steepener in Athena.
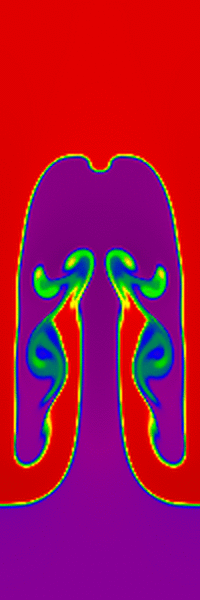
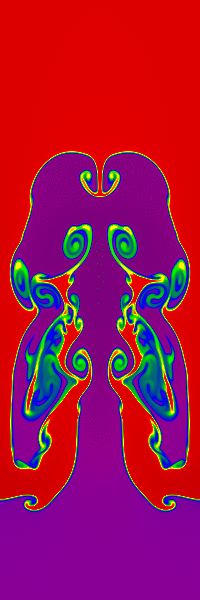
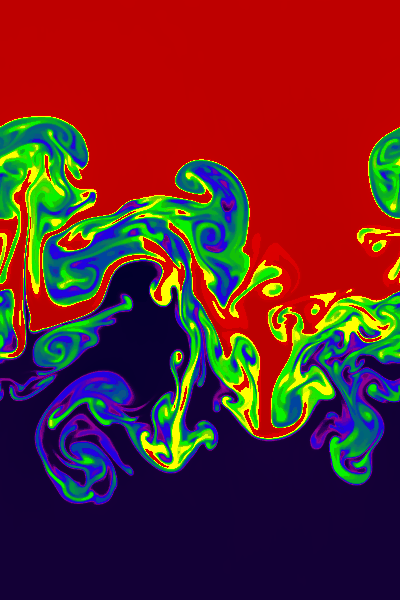
Results computed with Athena using the HLLC solver and the third order algorithm on a 100x300 grid are shown on the left below, and on a 200x600 grid on the right below. The images show the density on a linear color map between 0.9 and 2.1. Both are shown at a time of 12.75. The images should be compared to Figure 4.8 in L&W, which is at the same dimensionless time (we have used a larger computational domain).
Differences in the amount of small scale structure associated with the interface can be due to (1) the fact that we have perturbed the interface using velocity rather than position (the latter introduces grid noise), (2) the way in which source terms are included in the equations (which can introduce noise if exact hydrostatic equilibrium is not maintained), and (3) the use of a contact steepener.
Click on the right image to download a .gif movie (21.3MB).
 |

|
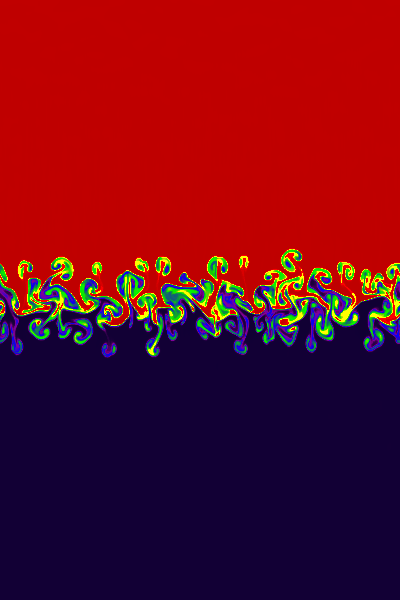
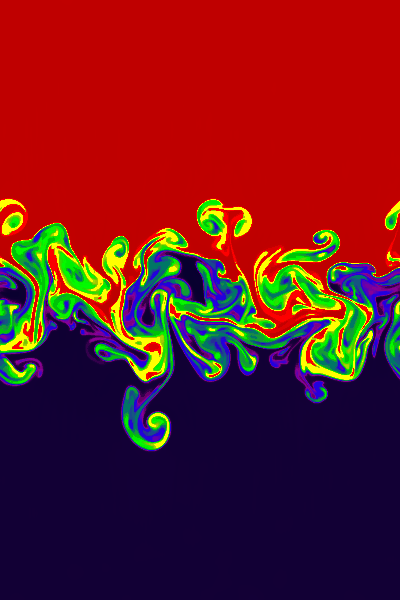
Results computed with Athena using the HLLC solver and the third order algorithm on a 400x600 grid are shown below at times of 4.47 (left), 8.94 (center), and 13.42 (right). The images show the density on a linear color map between 0.99 and 2.01.
The results can be compared directly to Figure 10 in Jun et al. (1995), although they used a density ratio of 20 instead on one as used here.
Click on the right image to download a .gif movie (22MB).
 |
 |
|
The initial magnetic field is uniform everywhere with Bx / (4π)1/2 = 0.0125.
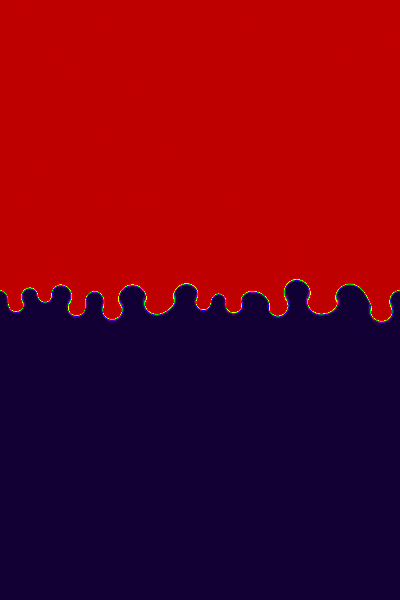
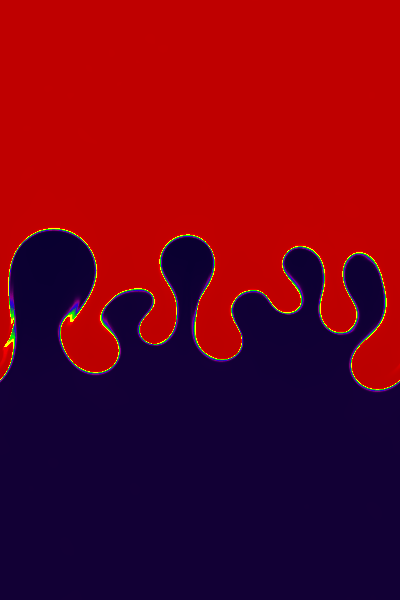
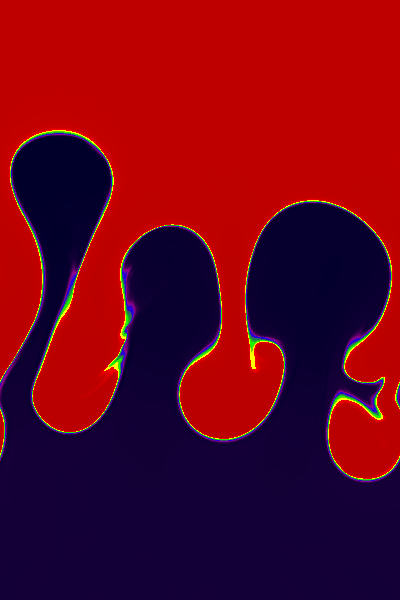
Results computed with Athena using the Roe solver and the third order algorithm on a 400x600 grid are shown below at times of 4.47 (left), 8.94 (center), and 13.42 (right). The images show the density on a linear color map between 0.99 and 2.01.
The results can be compared directly to Figure 12 in Jun et al. (1995), although they used a density ratio of 20 instead on one as used here. Note the magnetic field stabilizes short wavelength modes and prevents mixing of the fluids. Athena is able to keep the CD between the two fluids extremely sharp throughout the evolution (except where short-lived secondary KH rolls have occurred -- see the movie).
Click on the right image to download a .gif movie (22MB).
 |
 |
|