
The Hydrodynamical Implosion Test |
Liska, R., & Wendroff, B., "Comparison of Several difference schemes on 1D and 2D Test problems for the Euler equations", available on the web. The test is described in section 4.7 of LW, although it was presented in an earlier paper by Hui et al. (JCP, 153, 596, 1999).
The problem domain is the square, 0 ≤ x ≤ 0.3; 0 ≤ y ≤ 0.3. The boundary conditions are reflecting walls everywhere. For x+y > 0.15, the initial density and pressure is 1.0, otherwise ρ = 0.125 and P = 0.14. The gas constant is γ = 1.4. Initial velocities are zero everywhere.
The problem is essentially the Sod shocktube in a 2D box, with the shock and rarefaction launched along the diagonal x = y.
This test is exquisitely sensitive to the ability of the algorithm to maintain symmetry across the diagonal x = y. It also provides a measure of the rate of numerical diffusion of contact discontinuities.
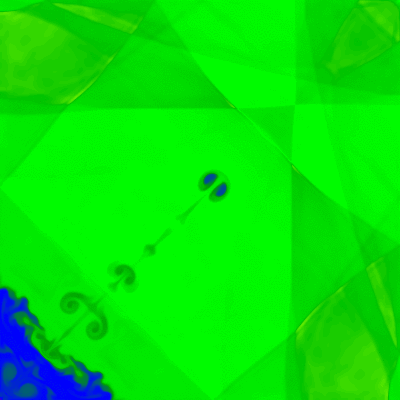
The time evolution of the flow in this test is really quite interesting. A shock wave is launched by the initially discontinuity diagonally toward the origin (lower left corner). As this shock interacts with the reflecting walls, it undergoes a double Mach reflection along the two edges x = 0 and y = 0. The jets produced by these reflections (see the Double Mach Reflection test page) eventually collide at the origin, and squirt a narrow jet of dense gas along the diagonal. Thereafter reflected shocks in the box continually interact with this jet. Fingers and filaments along the CD are generated by the Richtmyer-Meshkov instability as shocks cross it.
If the two jets produced by the interaction of the initial shock with the walls do not meet at the origin exactly symmetrically, a single jet along the diagonal will not be produced. This is clearly demonstrated in Figure 4.11 of LW. Generally, schemes which use directional splitting will not produce a diagonal jet. The jet will not be as long or as narrow in schemes with higher numerical diffusion of CDs (as demonstrated, for example, by comparing results from Athena run at 2nd versus 3rd order).
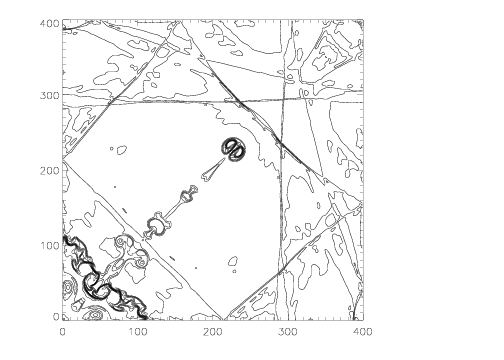
Results computed with Athena using the Roe solver on a 400x400 grid are shown below. Third order interpolation was used. No artificial viscosity, flatteners, or extra diffusion of any kind was used.
The contour plot on the left shows the density at the final time t=2.5, using 31 contour between dmin=0.35 and dmax=1.1. This plot can be compared directly to Figure 4.11 in LW. Note the contours are exactly symmetric.
Click on the image on the right to download a animate-gif movie of the density (32.5 MB). A linear color map is used between ρmin = 0.2 and ρmax = 1.5
 |

|