Self-Regulation of Star Formation in Disk Galaxies
Many different physical processes contribute in shaping
galactic "ecosystems." To understand galactic structure,
morphology, and evolution, a key question is what regulates the star
formation rate. Star formation converts gas - the original "raw
material" of the universe - into stars. Because stars impact their
environment, the rate at which gas can collapse to make new stars is
affected by the previous generation of star formation.
Here, we introduce the "actors" in the galactic pageant, and describe
new research that has begun to explain how star formation regulates
itself.
As seen in both the
contemporary, nearby Universe and looking back to early epochs,
star formation takes place primarily in disk galaxies.
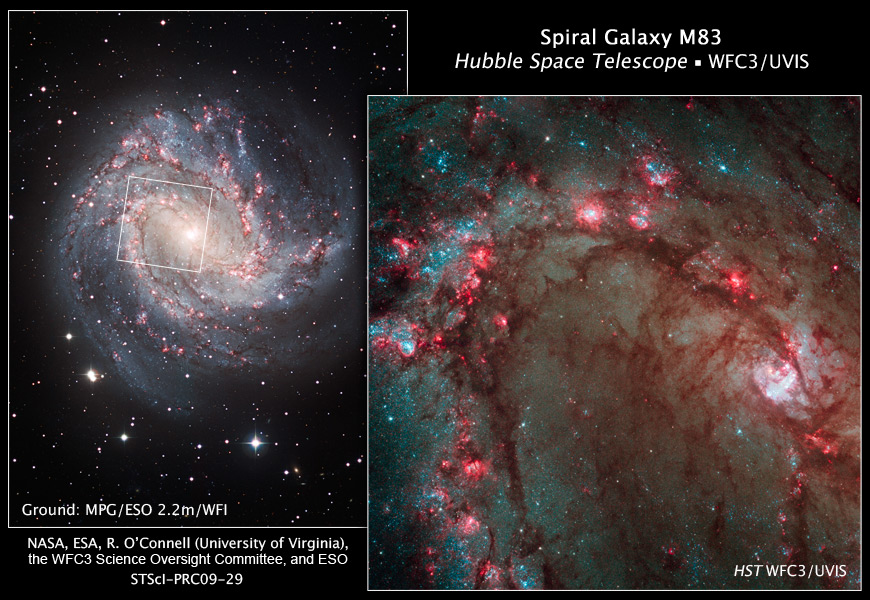
These galaxies are flat, and when seen "face-on" often show twin-armed
spiral patterns that swirl outward from the galactic center. Views of
these arms with optical and ultraviolet telescopes (as in M83, right
and below) show concentrated clumps of luminous star-forming regions.
Star-forming regions (red clumps in the M83 image below) host clusters
containing thousands of stars, including many stars 10 or more times as
massive as our own Sun. These massive stars emit prodigious radiation,
which heats and ionizes the surrounding gas, creating "HII regions"
locally.
A substantial amount of radiation also escapes from star-forming
regions, to heat the interstellar medium
(ISM).
|
M83 (NGC 5236)
the Southern Pinwheel galaxy
(courtesty of ESO) |
|
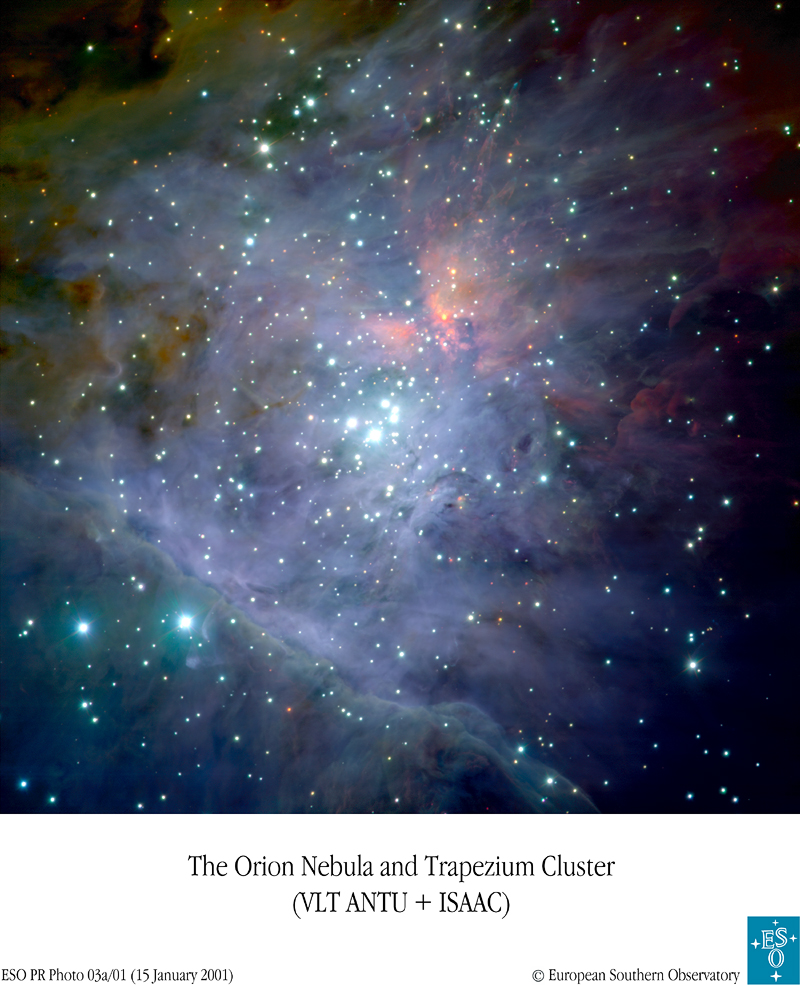
Low mass, low-luminosity stars like our Sun are the most common in
galaxies. Because massive stars have short lifetimes (10
Myr) compared to low-mass stars (1000 Myr or more), high mass stars are
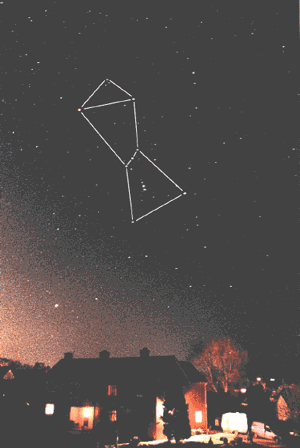
concentrated in young, star-forming regions (like the Trapezium cluster
in the Orion constellation, left). Over time, dispersal of clusters
distributes the surviving low-mass stars throughout the galactic
disk.
|
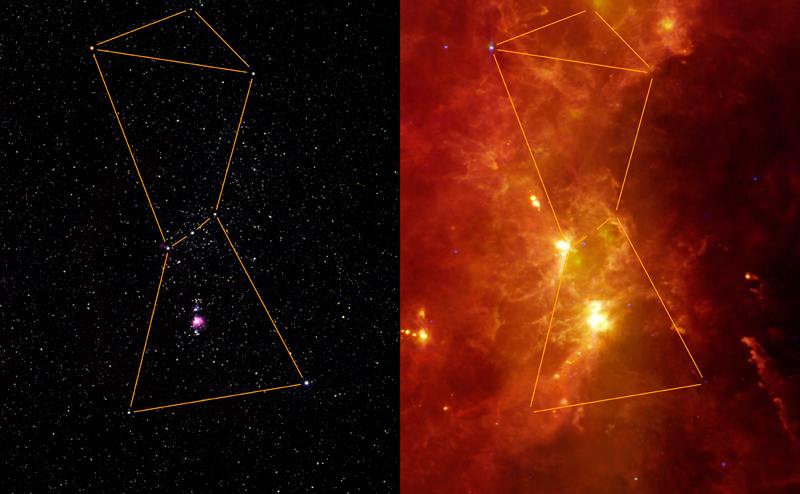
Forming star clusters are
surrounded by dense
clouds of molecular gas and dust. The stars in the cluster
originate as the densest portions of the cloud, which collapse under
their own weight.
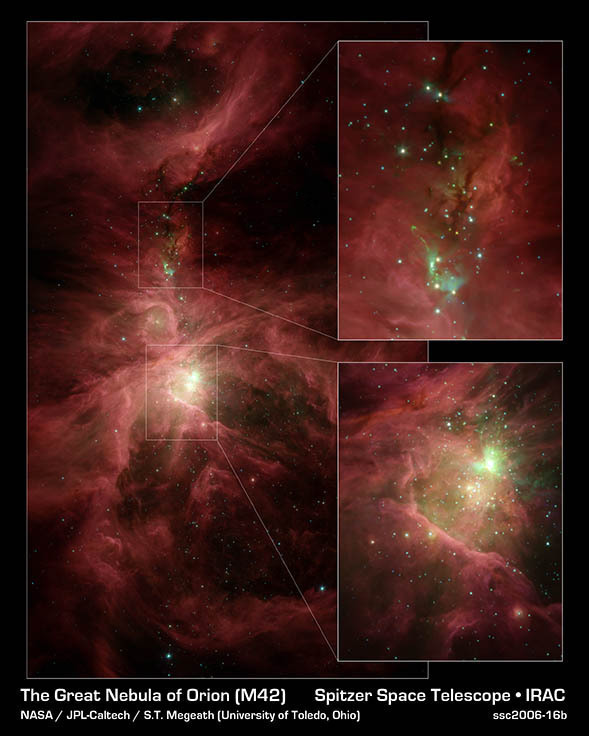
The Trapezium cluster (above) is also shown in the image to
the right, where it is embedded in its birth cloud. This cloud, part of
the Orion A molecular cloud in the southern part of the constellation
Orion (below), is observed by the Spitzer
Space Telescope (right) and
the IRAS telescope (below) in
the infrared radiation from warm dust.
|
|
The giant molecular clouds
(GMCs) where star formation takes place are the densest,
coldest parts of the interstellar medium
(ISM). Because most of the gas is only about 10 degrees
Kelvin above absolute zero, it is invisible in optical images.
With radio telescopes that can detect emission from the molecules at mm
wavelengths, the cold gas comes into view.
Molecular gas is concentrated in the spiral arms of galaxies, as seen
in the maps of the Whirlpool Galaxy (M51/NGC 5194) below. In most
galaxies, the atomic medium is the main reservoir of interstellar
gas. The atomic
medium is typically more spatially distributed than the
molecular medium.
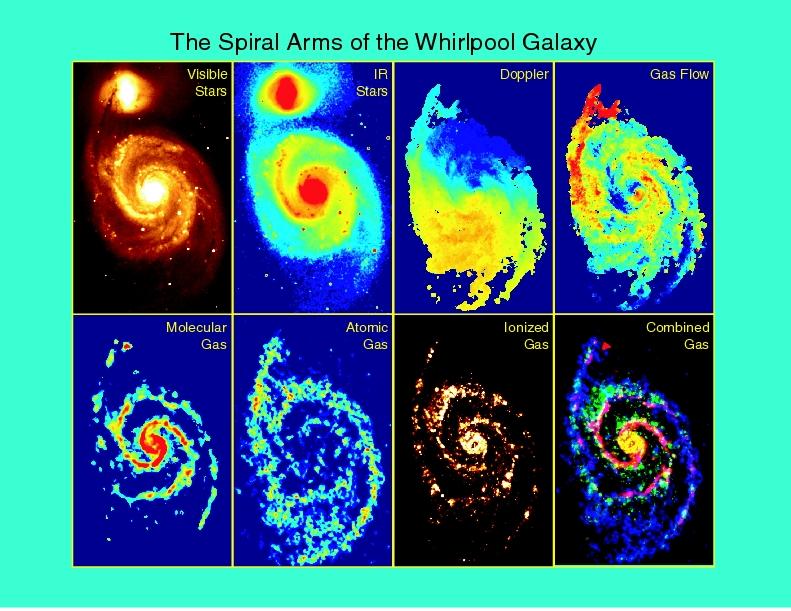
Multiwavelength M51 (image courtesty S. Vogel/UMD)
|
Orion giant molecular cloud seen in CO emission, along with an optical
image of the same region (image credit: CfA, Tom Dame)
|
When massive stars die,
they explode as supernovae
(SNe). The explosion blasts into the surrounding interstellar
gas, with shock waves heating and accelerating the gas to hundreds of
km/s. Over time, the expanding supernova remnant shares its
energy with gas over the whole thickness of the galactic disk. The
shocked gas eventually cools and returns to the normal temperature of
the ISM (100-10,000 K), but the momentum imparted by the supernova
makes the gas continue to expand outward. The energy from many
expanding supernova blasts combines to generate turbulence in
the interstellar medium.
|
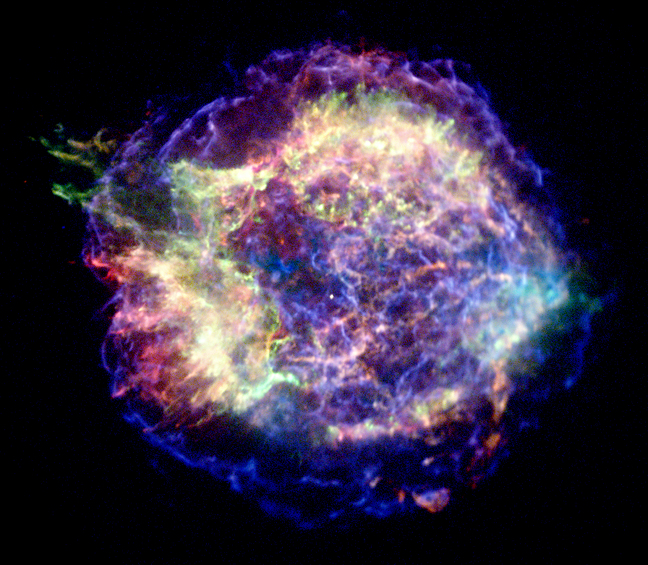
Cassiopeia A supernova remnant, as seen
in X rays (Credit: NASA/CXC/MIT/UMass
Amherst/M.D.Stage et al.)
|
To model the ISM and star formation theoretically, we must
consider how the gas in a galaxy evolves. Gas is vertically
distributed throughout the disk, but the ISM is far from uniform.
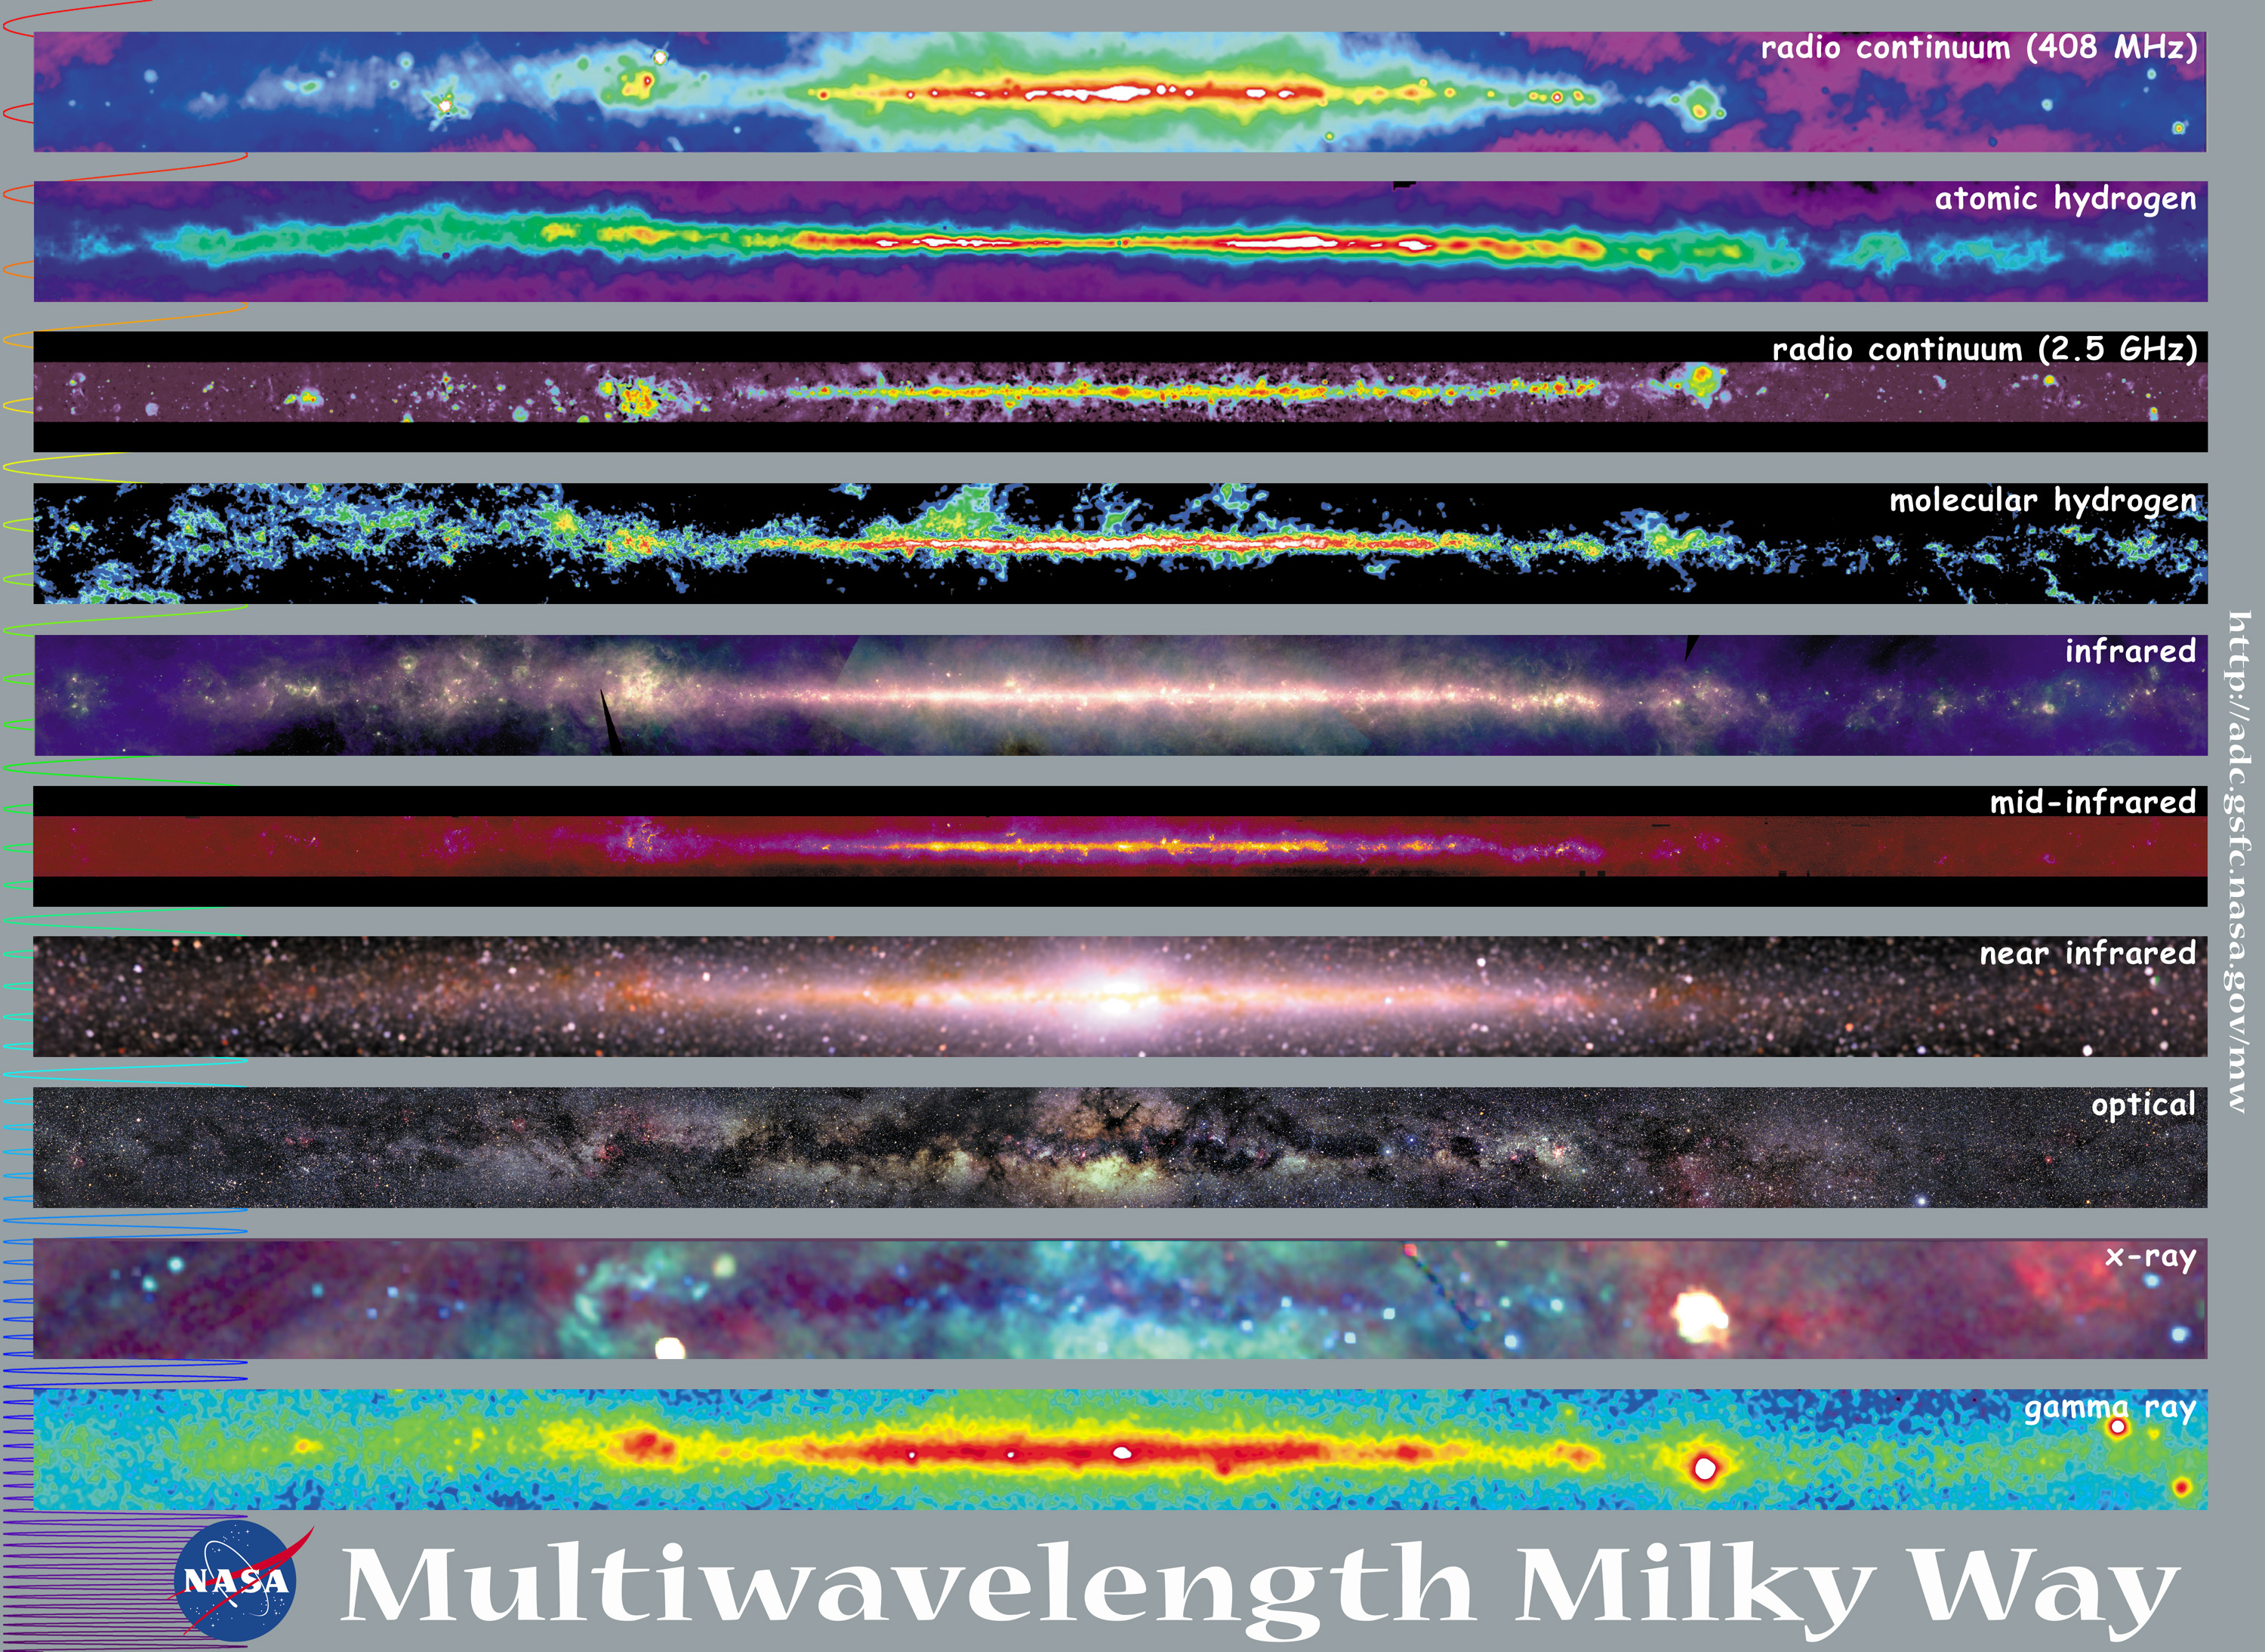
Images of our own Milky Way (below) show what the emission from the
gas, dust, and stars in the disk looks like "edge-on".
We use computational models
to follow the evolution of gas in a galaxies like the Milky
Way.
In our numerical models, we consider a small section of the
disk, so that we have enough resolution to follow the details of the
gas motions.
The movie below shows an example of gas evolution for conditions
similar to those in the "Solar neighborhood" in our own Milky Way. The
total duration of the animation represents approximately two galactic
orbits, or ~500 Myr. The movie shows a radial-vertical slice through
the interstellar medium (1kpc radial x 500 pc vertical dimensions).
In the simulation, we initially start with smooth conditions and a
uniform temperature. However, due to a process called thermal instability
(see here
for a description of our research on this topic), the gas rapidly
separates into a distribution of cold, dense clouds surrounded by a
warm, diffuse intercloud medium. The cold clouds are overdense by
a factor of 100, so they sink (like a stone!) toward the midplane of
the galaxy. As soon as a thin, dense layer collects at the
midplane, the gravity of the cold, dense gas causes it to collapse gravitationally.
Since collapse leads to star formation and star formation leads to
energy injection from high-mass stars (see above), energy is injected
into the gas in the surroundings of these star formation sites.
The feedback energy
disperses both the cold, dense gas and the warm, diffuse gas vertically
and horizontally, driving turbulence.
As the movie shows, the result is a cycle that is repeated over and
over -- although never exactly the same: dispersed gas collapses to the
midplane, which leads to star formation in the densest regions, which
leads to energy injection from supernovae, which disperses the
gas once again.

Evolution of a
radial-vertical slice through the interstellar medium
credit: Kim, Kim, & Ostriker (2011),
the Astrophysical Journal
Based on many "numerical experiments" like the one illustrated
above, we are able to determine how the detailed properties of star
formation and the interstellar medium are expected to depend on the
total amount of gas and stars that are present in a local region of a
galaxy.
Properties that we can measure in our computational models include the star formation rate,
the average velocity
dispersion of the turbulent motions, and the proportions of gas
in warm and cold phases. The results from these numerical models
are in good agreement with a theory we have developed for
"self-regulated" star formation. In this theory, we show that in order
for thermal, turbulent, and dynamical equilibrium all to be
simultaneously satsified, star formation must continually inject energy
into the interstellar medium. The conditions in the interstellar medium
and the star formation rate mutually adjust until the rate of energy
input from feedback offsets the rate of energy losses.
The dissipation of turbulent energy heats the interstellar
gas, and the gas is also heated by starlight. Energy is lost from the
interstellar medium when the atoms, molecules, and dust radiate away
the energy they have acquired. This "cooling" radiation (from nearby
and distant galaxies) is observed using optical, infrared, and radio
telescopes.
The star formation rates, turbulence levels, and balance of phases
predicted by the theory and found in our computational models also
agree with observations of the Milky Way and other nearby spiral
galaxies.
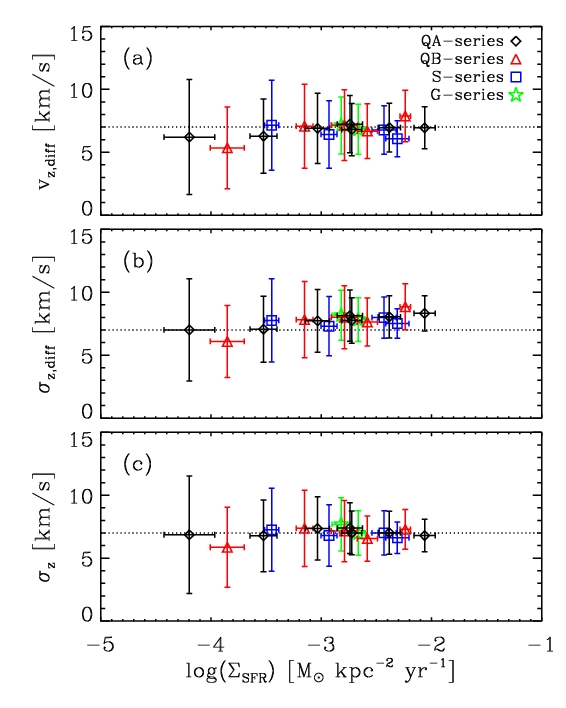
Turbulent vertical velocity dispersion in diffuse gas (top), total
(turbulent+thermal) vertical velocity dispersion in diffuse gas
(middle), total velocity dispersion in all gas (bottom). Velocity
dispersions are independent of the star formation rate because driving
and dissipation rates scale together.
Credit: Kim, Kim, & Ostriker 2011, The Astrophysical Journal
|
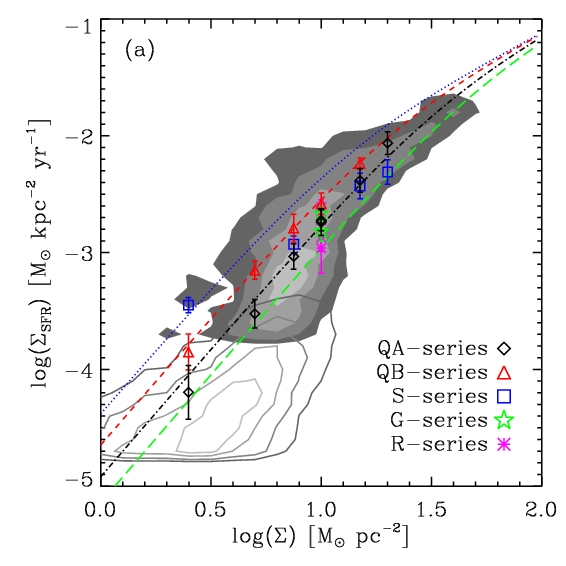
Star formation rate per unit area vs. gas surface density per unit
area, based on numerical simulations (colored points). Different
numerical "series" correspond to different ratios for the mass of old
stars/mass of interstellar gas in the input galaxy model.
Greyscale in background shows observations of star formation vs. gas in
a sample of nearby disk galaxies, with properties similar to the
numerical simulations. Grey contours show observed star formation and
gas in far outer disks (which have weaker stellar disks than we adopt
for our numerical models). Observational data is from Bigiel et al
(2011).
Credit: Kim, Kim, & Ostriker 2011, The Astrophysical Journal
|
For more information, see:
Our publications
Return to Eve
Ostriker's Research Page
Return to Eve
Ostriker's
Home Page
This material is based upon work
supported by the National Science Foundation (NSF) under Grant No.
AST-0908185. Any opinions, findings, conclusions, or recommendations
expressed in this material are those of the author(s) and do not
necessarily reflect the views of the NSF.