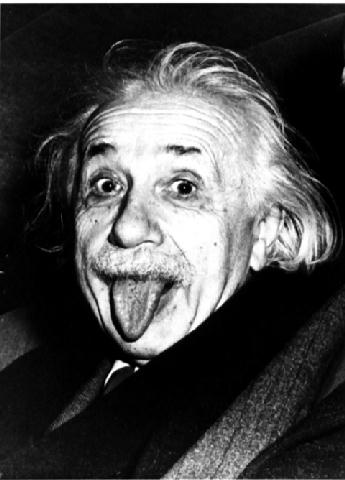
 The MAP (Microwave Anisotropy Probe) satellite also hopes to measure the curvature of the Universe by using a technique similar to the angle measuring technique described above. While at first thought it might be easiest to use lasers and actually draw large triangles through space, this is not a very practical experiment. The actual technique, however, does something very similar. The MAP satellite, after it is launched in the Summer of 2001, will look at the cosmic microwave background, which is energy left over from when the universe was hot and dense and is now stretched out and cooled. The satellite will look specifically at very tiny fluctuations in the otherwise very uniform temperature of the cosmic microwave background. The scientists involved with MAP expect that the largest fluctuations will be 1 degree on the sky. They are the fluctuations that correspond to the distance a sound wave can travel from the hottest densest moment of the universe's history, sometimes called the big bang, to a moment when the energy had cooled down to 4000 kelvin (Temperature in kelvin = degrees Celsius - 273). This distance is called the sonic horizon. The reason this distance is easy to measure is because the soup of protons and electrons which made up the early universe was so hot that light could not easily get through it. Think of this soup as a rain cloud. The cloud is not transparent to light; the light has a hard time getting through the cloud. The water vapor right next to the cloud, however, is transparent to light and light can travel easily straight through it. If something, perhaps a giant explosion, made a big wave in the cloud we could see it on the surface of the cloud. If we knew some of the properties of the cloud, for example the density of the cloud, and what was causing the wave we should be able to predict how big the wave would be. The early universe was like this cloud and the wave on the surface, which in this case is called the surface of last scatter, is analogous to the sonic horizon. Now, what can we do with this sonic horizon? Think back to the triangle experiment. If we knew the length of one of the sides and the angle across from it on a flat surface, and then we measured that angle on another surface and it was smaller, then we would know that our triangle was on a hyperbolic or negatively curved space. Conversely, if we measured the angle and it was larger than the angle we expected on the flat triangle, then we would know our triangle would be on a spherical or positively curved space. The MAP scientists will look at the sonic horizon and measure the angle it covers on the sky. They expect this angle to be 1 degree, but if the curvature of the universe is something other than flat then the angle they measure will be different. Students can think of this angle change as a remapping of the way light appears on the sky. To return to the example of the Earth, mapping the surface of the Earth, which is a two dimensional surface in three dimensions, to a flat sheet of paper is difficult to do well. Many different ways have been developed. They are known as Map Projections. Unfortunately many different maps distort either angles or distances and consequently distort our perceptions of things like relative continent size. Take the Mercator projection for example: It distorts the size of Greenland making it nearly as large as Africa. There are several activities you can have students complete to understand the distortions maps create when modeling the surface of the Earth. Here is an activity which describes how to make a Mercator Projection map. I would suggest after creating the grid as described here you paste some paper shapes on the globe and have the students draw in the shapes using their coordinates in latitude and longitude. By using regular shapes that are the same size on different parts of the globe the distortion becomes very clear. There are also many web sites which describe many map projections. Here are a few. http://www.ahand.unicamp.br/~furuti/ST/Cart/CartProp/DistPres/distPres.html http://tectonic.nationalgeographic.com/2000/exploration/projections/index.cfm http://everest.hunter.cuny.edu/mp/ If you have the resources available you could have students look up many projections on the web and have them report to the class about the distortions of their particular map. Another fun example which illustrates distortion is looking at a picture which has been mapped to a globe. Here is a 2-D picture of Albert Einstein. Here is how it looks mapped using an orthographic projection. An orthogrphic projection shows a 2 dimensional depiction of a three dimentional surface
Here is how it looks when many of these 2 dimensional images are put together to give the illusion of a three dimensional mapping of Einstein's Picture:
 Back | Next |
 39
39