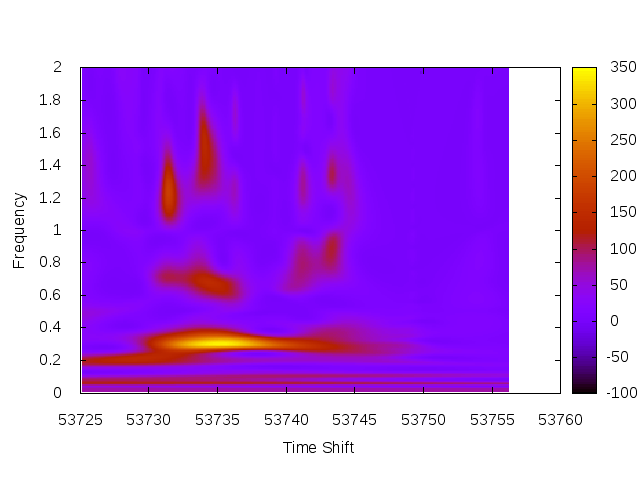
Fig 1. 2-dimensional WWZ transform from Example 1.
Syntax:
-wwz <"maxfreq" <"auto" | maxfreq>> <"freqsamp" freqsamp> <"tau0" <"auto" | tau0>> <"tau1" <"auto" | tau1>> <"dtau" <"auto" | dtau>> ["c" cval] ["outfulltransform" outdir ["fits" | "pm3d"] ["format" format]] ["outmaxtransform" outdir ["format" format]] Example 1.
$ ./vartools -i EXAMPLES/8 -oneline \
    -wwz maxfreq 2.0 freqsamp 0.25 tau0 auto tau1 auto dtau 0.1 \
        outfulltransform EXAMPLES/OUTDIR1/ pm3d \
        outmaxtransform EXAMPLES/OUTDIR1

Name                = EXAMPLES/8
MaxWWZ_0            = 345.87167006071132
MaxWWZ_Freq_0       = 0.30645161290322581
MaxWWZ_TShift_0     = 53735.173920000001
MaxWWZ_Power_0      = 243.91899737448088
MaxWWZ_Amplitude_0  = 0.0019655476933700114
MaxWWZ_Neffective_0 = 1651.192187564548
MaxWWZ_AverageMag_0 = 10.611015587079519
Med_WWZ_0           = 135.53839042847693
Med_Freq_0          = 0.20967741935483872
Med_Power_0         = 116.72893440099938
Med_Amplitude_0     = 0.00096335163669205139
Med_Neffective_0    = 2188.0750923512305
Med_AverageMag_0    = 10.611486630808924

$ gnuplot
gnuplot> set pm3d map
gnuplot> unset key
gnuplot> set xlabel "Time Shift"
gnuplot> set ylabel "Frequency"
gnuplot> splot "EXAMPLES/OUTDIR1/8.wwz" u 1:2:3
Calculate the Weighted-Wavelet Z-Transform for the light curve stored in EXAMPLES/8. The transform will be calculated for frequencies between 0 and 2.0 cycles per day, using a frequency step-size of 0.25/T where T is the difference between the last and first observation times in the light curve. We will consider time-shifts running from the first observation to the last (done by setting both tau0 and tau1 to auto) in steps of 0.1 days. The full 2-d transform will be output to the file EXAMPLES/OUTDIR1/8.wwz, while the maximum Z frequency for each time-shift (i.e. the projection of the wavelet onto the time-shift axis) will be output to the file EXAMPLES/OUTDIR1/8.mwwz. For the full 2-d transform we will output the file in the gnuplot "pm3d" format. A plot of the full transform may then be generated in gnuplot using the commands listed above.
A significant periodic signal is seen in this light curve around the time 53735.17392 with a frequency of 0.30645 cycles per day. This signal is not present near the beginning or end of the time series.
Fig 1. 2-dimensional WWZ transform from Example 1.