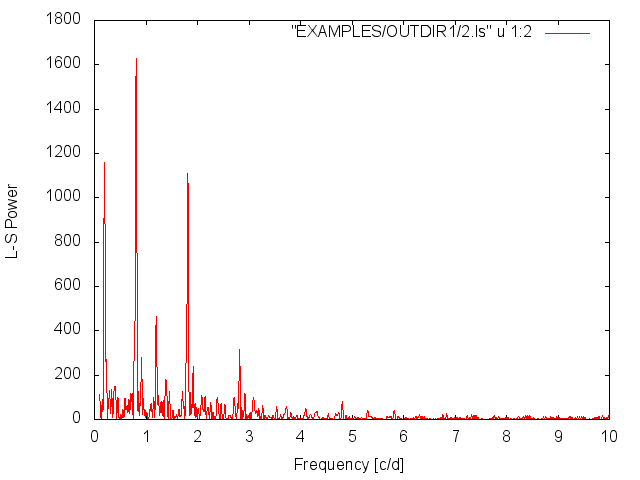
Fig 1. Lomb-Scargle Periodogram From Example 1.
Syntax:
-LS minp maxp subsample Npeaks operiodogram [outdir] ["whiten"] ["clip" clip clipiter] ["fixperiodSNR" <"aov" | "ls" | "injectharm" | "fix" period | "spec" | "fixcolumn" <colname | colnum>>] Example 1.
$ ./vartools -i EXAMPLES/2 -oneline -ascii \
    -LS 0.1 10. 0.1 5 1 EXAMPLES/OUTDIR1 whiten clip 5. 1

Name              = EXAMPLES/2
LS_Period_1_0     =     1.23440877
Log10_LS_Prob_1_0 = -704.49194
LS_SNR_1_0        =  126.52865
LS_Period_2_0     =     0.54573861
Log10_LS_Prob_2_0 =  -60.19769
LS_SNR_2_0        =   12.22747
LS_Period_3_0     =     0.55647766
Log10_LS_Prob_3_0 =  -52.64556
LS_SNR_3_0        =    9.46714
LS_Period_4_0     =     0.25922584
Log10_LS_Prob_4_0 =  -28.26507
LS_SNR_4_0        =    7.42006
LS_Period_5_0     =     0.50172744
Log10_LS_Prob_5_0 =  -25.89142
LS_SNR_5_0        =    8.63338
Run the Lomb-Scargle period-finding algorithm on the light curve EXAMPLES/2. Search for periods between 0.1 and 10.0 days at a frequency resolution of 0.1/T (T is the time-span of the lc, 31.1d in this case). Report the top 5 peaks, and output the periodogram to EXAMPLES/OUTDIR1 (the filename will be EXAMPLES/OUTDIR1/2.ls, the -ascii option causes the output to be in ascii rather than the default binary format). Pre-whiten the light curve and re-apply L-S before finding the next peak, and use a 5 sigma iterative clipping in determining the spectroscopic S/N.
Fig 1. Lomb-Scargle Periodogram From Example 1.
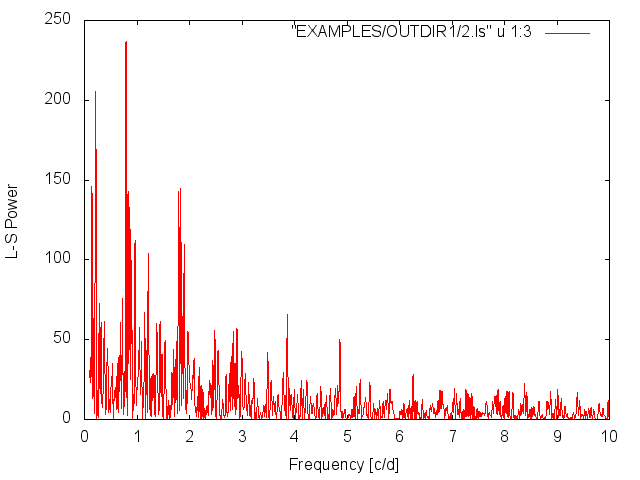
Fig 2. Lomb-Scargle Periodogram after removing the signal corresponding to the highest peak in the initial periodogram.