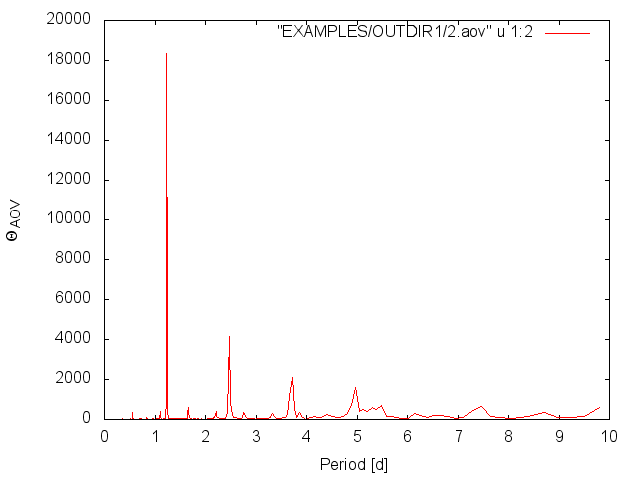
Fig 1. AoV Periodogram for the first peak computed in Example 1.
Syntax:
-aov ["Nbin" Nbin] minp maxp subsample finetune Npeaks operiodogram [outdir] ["whiten"] ["clip" clip clipiter] ["uselog"] ["fixperiodSNR" <"aov" | "ls" | "injectharm" | "fix" period | "spec" | "fixcolumn" <colname | colnum>>] Example 1.
$./vartools -i EXAMPLES/2 -oneline -ascii \
    -aov Nbin 20 0.1 10. 0.1 0.01 5 1 EXAMPLES/OUTDIR1 \
        whiten clip 5. 1

Name               = EXAMPLES/2
Period_1_0         =     1.23583047
AOV_1_0            = 18330.55450
AOV_SNR_1_0        = 7260.34519
AOV_NEG_LN_FAP_1_0 = 7633.23914
Period_2_0         =     0.13011657
AOV_2_0            =  45.37532
AOV_SNR_2_0        =  20.21064
AOV_NEG_LN_FAP_2_0 = 339.21684
Period_3_0         =     0.17657032
AOV_3_0            =  49.35941
AOV_SNR_3_0        =  27.39833
AOV_NEG_LN_FAP_3_0 = 368.38239
Period_4_0         =     0.12675512
AOV_4_0            =  15.24895
AOV_SNR_4_0        =   7.57564
AOV_NEG_LN_FAP_4_0 = 103.14339
Period_5_0         =     0.12056969
AOV_5_0            =  16.69317
AOV_SNR_5_0        =   9.40720
AOV_NEG_LN_FAP_5_0 = 115.00693
Runs the phase-binning AoV period-finding algorithm on the light curve EXAMPLES/2. 20 phase-bins are used. Periods between 0.1 and 10.0 days are searched. The coarse search is done at a frequency resolution of 0.1/T (T is the time-span of the lc, 31.1d in this case). The fine search around the peaks is done at a frequency resolution of 0.01/T. The top 5 peaks are identified, between each cycle the best-fit signal is removed and the periodogram is regenerated. The periodogram is output (the '-ascii' flag ensures that it is output as an ascii file rather than a binary file) to the directory EXAMPLES/OUTDIR1. The filename will be 2.aov. An iterative 5-sigma clipping is applied when identifying peaks in the periodogram.
Fig 1. AoV Periodogram for the first peak computed in Example 1.