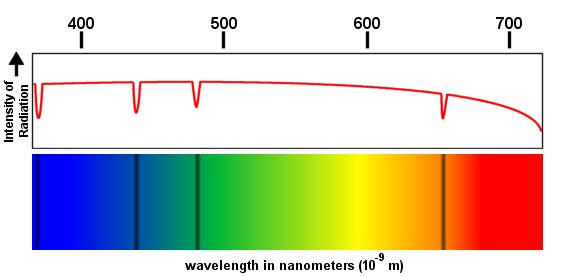
 For a simple outdoor activity which analyzes everyday Doppler Shift devised by Kara C. Granger see http://www.astrocappella.com/activities/dopp_lp.html. Fortunately for astronomers, the information that they receive from stars in space is in the form of electromagnetic radiation There are several different ways in which a spectrum can be represented. The Absorption Line Spectrum looks like a rainbow in which the "features" appear as black lines at certain frequencies. In the Emission Line Spectrum, the features appear in color and the rest is dark. The Spectral Line diagram is a sort of squiggly line that shows the amount of energy at each particular wavelength. Here are examples of each of these types of spectra: 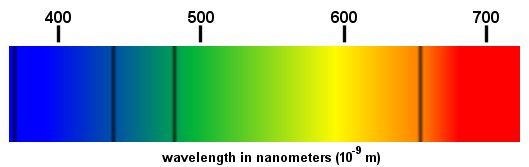 Absorption lines
These spectral diagrams may be complicated but once a student understands electromagnetic radiation and the spectrum it produces, a red shift of this spectrum can easily be used to measure distances. For an online introduction to light and spectrum in astronomic measurement see http://violet.pha.jhu.edu/~wpb/spectroscopy/spec_home.html. As mentioned above, the red shift occurs when the light emitting object is moving away from the observer; in this case, the star is moving away from Earth. A famous astronomer, Edwin Hubble (for whom the Hubble Space Telescope is named), discovered
To calculate the red shift, one must measure the distance that the spectrum has been shifted. Usually this is done by comparing the observed spectrum to one a standard. The formula for red shift is:
For example, if a feature on a spectrum is normally measured at 393.3 x 10⁻⁹ m and then that feature in a galaxy is measured at 401.8 x 10⁻⁹ m , the red shift of that galaxy would be:
and the speed at which the galaxy was moving away from Earth would be:
Then the distance to the galaxy would be:
 Back | Next |
 17
17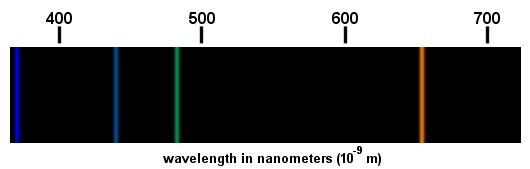
 .
.