As discussed in Chapter 10, the SDSS will generate about 40 TB of raw data at the telescope site, which will be shipped to Fermilab for reduction. After processing, the reduced data will be stored in the Operational Archive (OA) which supports the mission critical part of the survey. Its main functionality is to store the processed data in instrumental form, perform calibrations, and provide information for target selection and quality assurance. It will contain positions, colors, sizes, profiles, classification, calibration information, targeting information, housekeeping, logs, history, "atlas images" in five colors, spectra, spectral features and redshift.
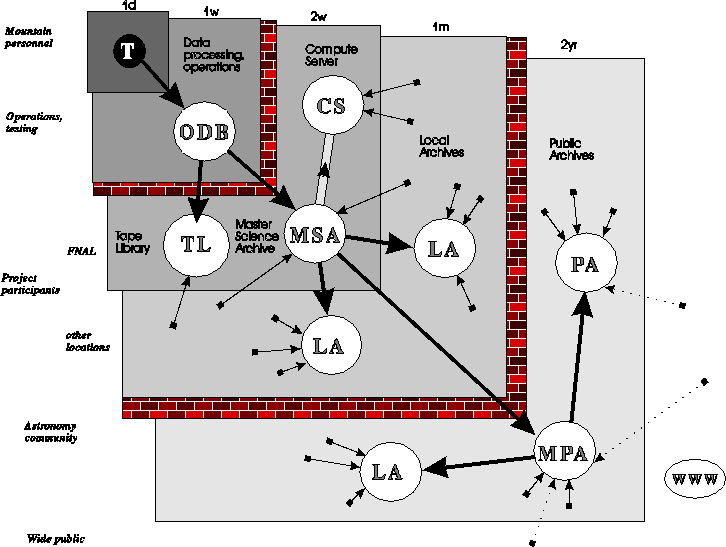
Data-flow diagram showing the various levels of data access and timescales. The labels on the left hand side describe the typical user, those on the top the timescale on which data will propagate to that level. The 40TB of raw data will be processed by a workstation farm at Fermilab, saved in the Operational Data Base, and can only be accessed by the operations personnel. To provide timely access for science testing and analysis, the data will be moved over to the Master Science Archive every one or two weeks.
For subsequent science queries the requirements are quite different: scientists expect to see a final calibrated data set, where they want to perform statistical queries of quite complex nature. Given the huge volume and complex nature of the data set, this is quite a demanding task. We are currently designing the Science Archive (SA) to support these activities. The Science Archive consists of the Master Science Archive, which resides at Fermilab, and derived replications at the collaboration member sites. The Science Archive will also serve as a pilot model for the subsequent public distribution system. The Science Archive is read-only and contains calibrated quantities only, but all housekeeping information, including calibration coefficients, is retained. One of the major design principles has been to build a system with maximum modularity and flexibility, since the data are expected to have a useful lifetime much beyond that of the people currently creating the archive. We also expect that this data set will become a de facto standard for the next century, with all other astronomical catalogs, both existing and future, cross-referenced against it.
The primary purpose of the Science Archive is to provide convenient, high speed access to the data. It can be split into multiple data products:
The Object Catalog will have a built-in multidimensional index, which enables a very quick search on all linear combinations of the 5 colors, a very flexible set of constraints involving the different angular coordinate systems on the sky, and angular proximity. Objects with similar properties will be stored together on the disk, achieving a very high level of cache efficiency when executing queries.
The Science Archive will use a three-tiered approach for maximum flexibility and portability. At the lowest level (Data Warehouse), the system will be built upon a commercially available object-oriented database engine, Objectivity, supported on a wide range of hardware platforms, and complying with several existing (SQL) and emerging (OQL, ODMG93) standards. The middle-ware will contain all the proprietary indexing and query optimizing software, written in strict C++, while the top level component provides a high level user interface, protecting the user from the details of how the data are organized in the lower layers. Our approach will also enable us to use a highly parallel database engine, should it become available.
Although substantial progress has been made in combining multi-frequency astronomical data sets (Helou et al. 1992, Cordova 1993), these approaches provide only limited scientific inquiry into the data; the size of data bases and the number of queries is causing substantial loads on database servers. Moreover, searches are generally restricted to simple positional queries, while with the multicolor nature of the SDSS dataset one might really wish to ask more complicated questions, e.g. "find all blue ( g' - r' <0.7m ) galaxies fainter than g' = 22m and within 3 arcseconds of a quasar brighter than r'=17." Such a query can be modeled quite succinctly as a geometric query to find all data points within a given distance of a specified simplex or hyperplane in the multidimensional space of galaxy colors. Such search techniques represent the cutting edge of research in computer science are not commercially available yet.
We have therefore undertaken a research program directed at the development and implementation of advanced data organization and querying techniques using the methodologies of object-oriented design and computational geometry. Our data organization methods are based upon a novel use of space partitioning schemes from computational geometry, such as k-d trees, to provide a mechanism that is effectively equivalent to a general multi-dimensional index, with typical access times growing only logarithmically with the number of data points. In addition, by adding a simple interactive feedback loop which utilizes the coarse grained density map that space partitioning provides, our approach allows simple and accurate prediction of query times and output size. A lot of queries -- especially those from novice users -- are unnecessarily broad, wasting substantial resources. By predicting query times and output volume (in a matter of seconds) users can adjust their search criteria or acknowledge and confirm before an extensive query is performed. This substantially reduces the load on servers, especially in the exploratory stage, while keeping the interaction between the user and the database at a maximum.
Current datasets are either big or complex, but seldom both. The next generation datasets are emerging as both big (many Terabytes) AND complex (spatial, multiwavelength). This poses several bottlenecks: the database size presents I/O problems, and the database complexity makes it hard to extract general features to detect similarities, i.e. associative relations. The approach we propose and describe in detail below enables us to solve both problems simultaneously: we can execute queries in parallel, and provide the database with the ability to search for similarities (spatial proximity) and to learn from examples.
Here we present a detailed description of these ideas and how we envisage their potential use and application with an object oriented database management system to solve the problem that the size and complex nature of the SDSS data set represents. We discuss the envisaged usage patterns, the underlying design principles of our system, the geometric organization of the data in the archive, the geometric query capabilities, and the system architecture.
Let us first discuss the phases of a typical search project that most scientists accessing the Archive will undertake. Even though this may seem trivial, we will see later how the support requirements of these activities naturally translate into requirements for the Science Archive.
Such activities involve the use of several search techniques, all of which have to be supported by the Science Archive.
Efficient Object Browsing requires access to parameters, the atlas images, the spectra, but only one field at a time. The image of a field can be reconstructed from the cut-out atlas images. During this phase of exploration the researcher will need access to various simple tools like xy plot, 1D-2D histograms, and calculating aggregates. A typical load time of 3-5 seconds to access a frame is acceptable. Since the images are stored on an object-by-object basis, this enables us to have an especially useful image display. Objects can be switched on/off individually, and we can thus show only the galaxies, stars, or QSOs. We can tag objects which have spectra, or satisfy certain conditions, and have their properties piped into external tools, for example IRAF, SM, IDL, and DERVISH/SHIVA. The log file for such manual browsing can be saved, and converted into a query for subsequent use.
These form the hardest problem, since the data set we are dealing with is close to a TB in size. It requires a high bandwidth to the data, efficient output handling, and good multi-dimensional indexing. The queries will use constraints on not just attributes but algorithmic methods, as well as linear combinations of attributes, and they have to be able to follow links to housekeeping or to spectral information. The implementation has to be able to make a lot of trial-and-error possible, by providing rapid feedback. It has to be highly customizable, and to use a standard query grammar (SQL/OQL). The system should be able to execute queries remotely in parallel, which can also be interrupted.
These searches are also non-trivial to execute in a traditional relational system. They consist of two queries and a distance, like our example of quasars near faint galaxies. The representation of the output can be quite complex, since there may be a lot of many-to-many associations. Also, the query optimization can be non-trivial.
We anticipate that the SDSS data set will be very heavily used for cross identification against all existing and future catalogs. Even though the schema of the database (class design) is still under construction, we have tried to address the issue of cross-references, and/or cross identifications rather early. Reserving a slot in the schema for all other cross-identifications is not feasible, because one cannot foresee all the applications so far in advance.
Almost every scientist working with the archive will want to save one or more customized subsets. Since these can be quite large, in the 100 GB+ range, this application needs to be addressed early on. If the data sets are small, flat output should be easy, and the data can be used off-line. If the data size is medium, data should not be copied out of the Archive, but one should save links to the objects, leave the data in place, and use the data within the archive. If the subset is large, i.e. comparable to the whole data set, one cannot even save the links to the objects, and the only way we currently envisage to retain information is to save the query script itself.
Eventually, some of these personalized subsets will evolve into new data products, which will become standards, within the project and beyond. Examples of these are clusters of galaxies and their members, a catalogue of galaxy and quasar absorption lines, variable stars, etc.
The data archiving scheme that we propose to implement is based on four design tenets: Object Oriented Programming (OOP), Distributed Processing, Spatial Data Structures, and Hierarchical Memory. Before we discuss the basic algorithmic components of our system, these four principles should be explored.
Historically, astronomical databases have relied upon relational database technology. A straightforward mapping existed between the `flat' data and the tabular records of the relational database. These records consisted of fields, which are fundamental data types, such as INT or CHAR. The querying mechanism was provided by a standard query language (SQL) augmented by index tables generated according to predefined key fields (e.g. position or magnitude). More recently these data types have been extended to include more complex data structures (e.g. multiwavelength images, spectra, dynamic length arrays) which are less suited to a tabular form.
In direct contrast to this is the Object Oriented Paradigm. This approach utilizes the fundamental relationships within the data, treating them as individual units rather than collections of attributes (e.g. a galaxy would be considered as an object whose schema might include coordinates, magnitudes and associated bitmap images and spectra). An object is, therefore, simply accessed as another datatype (equivalent to an INT or CHAR). How it is actually stored on a disk is hidden from the user. This allows efficient storage of complex data (positions can be stored as integers and returned as floats).
Implementing this paradigm within a database system, an OODBMS, adds the benefit of persistence. Accessing an object as a whole rather than as a collection of tabular attributes increases the speed of many queries by factors exceeding 10. A further benefit of using OODBMS is the ability to execute code (methods) on the server side. This is advantageous since the attributes of an object are extracted via method functions, allowing for a dynamic update of data without rebuilding the database. Thus, if the photometry or astrometry is recalibrated for a released catalog, only the access functions must be modified, saving a costly reissue of hundreds of CD-ROMs. In addition, the development of an Object Query Language (OQL), a superset of SQL, provides browsing tools and enhanced query capabilities. Given the potential of this approach for handling large multi-dimensional databases its evaluation and development in an astronomical environment is clearly necessary for the efficient handling of current and future data sets.
A client-server architecture provides the ability to distribute the processing load over multiple computers. A well defined protocol (TCP/IP) exists for the interprocess communication that enables the processes to be distributed in distance. The major design benefits of such a distributed processing system are flexibility, component isolation, and future expandability.
The flexibility of a client-server system arises from the separation of processing tasks. Processes can be optimized for a given CPU or operating environment. In addition, the processing load can be distributed in a redundant fashion that can be optimized to avoid congested archive sites when processing queries. Since each process is isolated from the rest of the system, commercial products can be easily integrated with minimal impact on the rest of the system while maintaining cross platform connectivity.
The client-server approach is easily expandable through the addition of more processing sites or additional archive databases through a notification action to the appropriate component processes in the system. The data retrieval can be expanded to a parallel I/O operation through the addition of multiple archive servers and media striping. This approach is easily adapted to interface to a massively parallel I/O machine, eliminating any code rewriting.
With the increase in the volumes of data sets how we partition these multidimensional data on the storage medium can severely affect our ability to conduct efficient searches. Our particular algorithm for splitting up a `k' dimensional volume is based upon the heuristic technique of k-d trees in which search times scale logarithmically with the number of data points (Friedman et al. 1977). This approach is becoming increasingly popular in computer science, especially in databases related to spatial structures (Samet 1989a,b). They find a special niche in the geographical information systems (GIS), a popular, rapidly growing area, quite similar in the nature of its queries to astrophysics.
The k-d tree is a multidimensional space partitioning scheme in which `d' dimensional data is split in `k' dimensions. Each tree node represents a subvolume of the parameter space, with the root node containing the entire `k' dimensional volume spanned by the data. A balanced binary tree is constructed by splitting each node into two sections along the median of the `k' dimension which will maximize the clustering of data in the two child nodes. The `k' dimensions can be actual attributes or the principal components of the parameter data.
Something that is often overlooked when algorithms are designed is that when they are implemented in practice they must contend with the fact that real computers do not have unlimited memory, as is the case in the theoretical RAM model. This is especially important for scientific computations that use very large data sets, where the number of objects in the data set can greatly exceed the space available in main memory on the computer (even a supercomputer). Thus, algorithms should be designed for fundamental problems that arise in our applications, so as to take into account the fact that the structures used by the algorithm may not completely fit in main memory. Instead, the memory space occupied by these structures must be partitioned into blocks, and these blocks must be periodically swapped in and out of main memory as the computation proceeds. One can, of course, rely on the operating system to decide how to partition the data and how to perform the swapping of blocks. However, one should be able to do better by a more explicit specification. Moreover, we believe that one can modify the algorithm so that it takes the blocking into account and performs better than would otherwise be possible when the blocking and swapping procedures are ignored (which is currently the case in most algorithm design). We have already done some of the foundational research for fundamental computational geometry problems, and we intend to next examine new blocking techniques for geometric databases and space-partitioning algorithms.
In the case of our space partitioning scheme, the number of levels in the tree is determined by maximizing the number of objects in a leaf node (container) with the constraint that the k-d tree must be small enough to reside in memory. The maximum cell size depends on the amount of available memory, disk partitions, total database size, and I/O bandwidth. The desire is to minimize I/O operations by pulling over a large enough set of data in one operation to minimize search times. Opposing this is the increased speed of a larger k-d tree. One method of circumventing this is to introduce the concept of a container, which could hold multiple cells. Thus a search request would be applied to the appropriate containers and the appropriate cells could then be extracted. This allows the k-d tree to be deeper, while minimizing I/O. This has the additional benefit of allowing a queuing approach to multiple searches of the same volume within the database.
Most large astrophysical data sets consist of points in a multidimensional space, linked with additional objects (images, spectra). Traditional indexing techniques are very efficient if the queries are by predetermined keys. However, with many data sets in astrophysics the nature of the queries is different, based upon a complex set of criteria, some of which will be similarity of properties, or spatial proximity of certain types of objects. Therefore, the spatial relations between the points in the multidimensional space have a very important role in all of these queries. If most of our searches are localized in `k' dimensional space, one can use these relations very effectively -- there is no need to search the regions that one can easily reject.
Here we propose that the data be organized hierarchically, split into `cells' (or `buckets') covering the `k' dimensional space, such that points near to one another (i.e. of similar properties) are stored together even on the physical media (in `containers') Optimally, the cells should be balanced, i.e. they should contain roughly an equal number of objects.
Since we store with each node its actual boundaries in the `k' dimensions, the k-d tree can also serve as a coarse grained density map of the actual data parameters, as well as an efficient multidimensional index. Queries are first performed on the k-d tree, limiting the query volume to those leaf nodes that fall within the query, prior to the entire database, resulting in predictions for the search time and estimated number of objects satisfying the search. This provides a feedback feature for the user, which can minimize costly queries. Since the k-d tree resides completely within the memory of the user's system, the feedback should be instantaneous. In addition, a list of the cells which intersect the query volume is also generated.
The actual dimensions chosen for partitioning could be the natural dimensions of the dataset, i.e. the fields of the database, or they could be a derived basis set that takes advantage of intrinsic correlations within the data. Choosing one of the natural dimensions on which to partition would be done by calculating an appropriate statistic, such as the variance, for all of the `k' dimensions, and splitting on the dimension with the greatest value. The partition value is then chosen to be the median value along the partition dimension. On the other hand, a derived basis might be calculated from a principal component method, which, though CPU intensive, may pay off in subsequent searches. This type of approach would provide an additional tool for serendipitous searches, since strange objects would reside away from the bulk of the data.
A more generalized method of partitioning the data can be determined algorithmically in terms of a cost function. At every node to be split, the field with the lowest associated cost will be chosen as the dimension to partition on. In this way our a priori knowledge of the most common search criteria is used to weight the partitioning algorithm (e.g. the primary source of queries may be positional, therefore we may wish to force an initial cut in declination). To ensure an even split in the available dimensions the cost function will be dynamical (i.e. when we split in a given dimension we can increase its cost). The first subdivision along any dimension will be to split off those data with indefinite values along that axis. This INDEF subset should not be divided further in that dimension: its cost will be infinite.
Maintenance of the k-d tree would be necessary as new data are added into the data base, whether as new fields (such as observations at different wavelengths) or improved data, or if cell boundaries need to be moved due to a major recalibration of the data (e.g. new astrometry coming from Hipparcos). This should be accomplished by modifying the k-d tree, either as a whole or, preferentially, via some of the sub-branches.
A further refinement comes in the storage of the data within the buckets. The most naive approach would be a linked list of data points sorted in spatial coordinates. Increased search efficiencies can be accomplished by an intelligent organization of the data within each bucket (Samet 1990a,b). Several methods under consideration are bit interleaf, hashing, standard indexing, and even a continued k-d tree.
Algorithms for searching can be visualized in a geometric manner as finding all data points within some search volume. If the number of dimensions in the search is less than the dimensionality of the database, the extra dimensions are projected down onto the hyperplane of the search request. Geometric searches, such as nearest neighbor or all objects within a metric distance from a given object, can be visualized as finding all points within the search ellipsoid or polyhedron.
Simple database queries can be modeled as cuts -- hyperplanes -- within the parameter space of the database. These parameter cuts can be combined using Boolean operators to create complicated query volumes. Geometric queries can be constructed through linear combinations of the parameters, and proximity cuts. Curved decision surfaces, separating different classes of objects, can be approximated by Boolean combinations of hyperplanes i.e. multidimensional polyhedra. This approach also allows associative queries to be performed, by first constructing a convex hull from a given sample of objects (training set), and then finding all other objects in the database that lie within this hull.
These geometric queries utilize the nodal boundaries to determine the containers that intersect the query volume and must be searched in more detail. One of the basic operations required is a quick rejection test of the rectangular cells to eliminate those cells that do not intersect the query volume. For those cells not rejected, the volume fraction of the intersection between the cell and the query volume must be estimated. These operations are typical examples of advances in computational geometry that are directly related to this work.
The system we have implemented can be subdivided into three different tiers: the User Interface, the Query Support Layer (QSL), and the Data Warehouse. Communication between the different tiers is accomplished through TCP/IP socket calls, enabling each tier to operate independently on optimized systems in different locations.
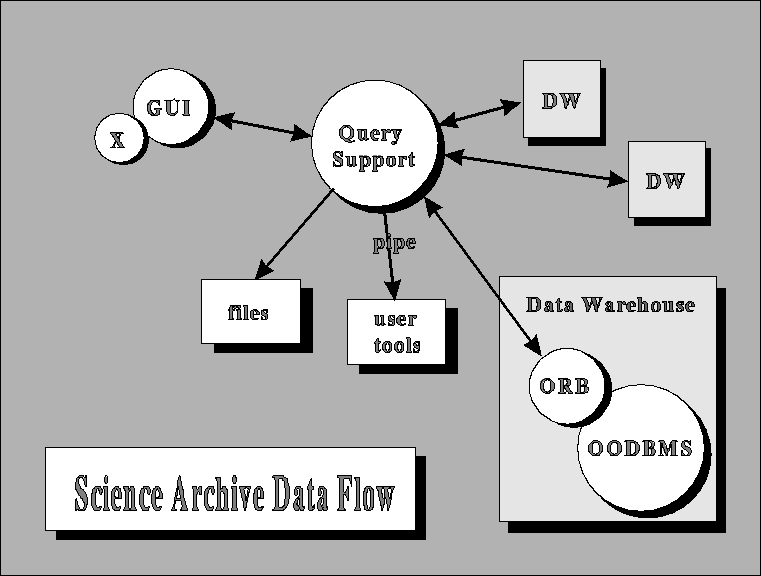
Data flow through the Science Archive
The topmost tier is the User Interface (both Graphic and Command Line Interface are supportable) where the query is constructed, the desired attributes selected, and the returned data processed. The user interface, which generates queries in a predefined syntax, would pass the request to the QSL, where it would be captured, and the search time and output volume evaluated. A small window would open, showing these quantities. A typical exploratory trial-and-error user would reduce the search volume by modifying the query, until an acceptable response time is reached (e.g. a few minutes), then explore the objects that the search provided. If satisfied, the limits would be slowly increased, and eventually a full search be done, but only after it has been ascertained that the output is along the lines of the user's intentions.
Several more powerful querying methods can be applied by utilizing the geometric querying capabilities of the system with the complexities primarily hidden from the user. One such method to access data and search by similarity would be by displaying a bitmap or a graph, where by clicking on certain objects, their properties would be loaded, through a hypertext link, into the center of the search cuts with some error bounds ("select all similar objects"). In a given area of the sky one would immediately see how many objects of similar properties (e.g. colors...) would there be, and one can again shrink or expand the search easily at wish. An example of associative querying would be to find the `k' nearest neighbors in a subspace (i.e. colors only). An example of supervised learning would involve the construction of a training set from a given sample of objects, which can then be applied to the entire dataset "Select all objects which match the pattern generated from the training set ". Finally, learning can be unsupervised, producing a complex decision surface which is then automatically translated into our query syntax.
The query support layer contains the coarse grained density map of the points in `k' dimensions, represented as a binary tree. For every cell we store the boundaries of the cells, the number of data points within it, and a reference to the location of the data. This cell-map is small enough to fit entirely in the memory of a typical workstation. Searches are first performed on this database, generating a linked list of cells that intersect with the search volume. At this point, without opening any of the containers (or cells), one can predict the volume and the time of the query. The search time can be predicted from the I/O bandwidth and seek times of the various storage media. The number of returned objects can be computed by scaling the total number of objects in a cell by the fraction of the cell that lies within the query volume. This information can then be returned to the user interface layer, where the query can be modified until an acceptable compromise is found. Each iteration can be accomplished within a few seconds.
Once the query is finalized, the QSL sends the query tree and list of cells that need to be searched to the appropriate data warehouse. This architecture can be easily parallelized if the data warehouse is composed of multiple servers: the list of cells is sent in subsets to the appropriate servers and then processed concurrently. The QSL can also utilize multiple data warehouses in different physical locations to minimize the query times: large complex queries may be best executed on a remote parallel server even with the network penalty, while simpler queries may be better done on a local server. Such resource allocation and sharing can be transparent to the user.
In our scheme, the data warehouse includes the actual data stored in the OODBMS, and an Object Request Broker (ORB) that then isolates the commercial software from the rest of the system. The ORB receives a query tree and a list of containers that intersect the query volume. The ORB translates the query tree into an OQL request to the database, which then returns an iterator containing the objects satisfying the OQL request. Any remaining query functions that could not be represented in the OQL syntax are then used to further pare down the object list. Once the final list is produced, the necessary attributes are extracted and passed back to the user via the QSL.
The extraction of the data from the OODBMS can be done in a highly optimized fashion; while we are searching through the contents of one cell in memory, the next cell is prefetched, utilizing the available I/O. The other advantage is that of customization: frequently accessed cells can be moved to faster physical storage, statically, or even dynamically, implementing a simple cacheing scheme by copying the contents of a cell to hard disk from a CD-ROM or optical disk, for example, and updating the pointer in the cell-database. One can also implement a queuing scheme: if the access time of containers is long, it may be worth queuing requests until several searches are performed on the contents of cells in the same container.
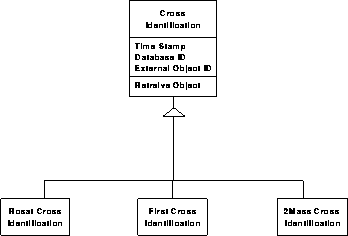
We propose to build into the structure of every object in the catalog a `cross-reference hook', a link (pointer) to a variable length object, set to NULL in the beginning, thus not taking up much space. If there is a new cross reference, we create a new cross- identification (XID) object in the database, which has a link to the SDSS object, but also has a unique pointer (catalog name, identification, etc.) to the external object. All these XID objects will be derived from the same base class, therefore their customization will require very little modification and extra programming of the original database. All these objects can be kept in a well defined separate part of the archive, which can be updated more frequently, as new cross-references are added. Through this indirection, the original catalogs can remain static, with only the XID objects modified.
What are the steps of creating cross-identifications between various catalogs, with very different errors, wavelength coverage, or positional accuracy? Clearly, every external catalog will have a lot of different systematics, and certain parts of the cross-identification process will be unique to those. On the other hand there will be a lot of common steps as well, inherently tied to the SDSS Archive. Here we would like to identify these, and we propose to create the necessary tools as part of our database and archive development.
1. It clearly requires a rapid search of the angular vicinity of every object to be cross-referenced. Our archival system will have a highly efficient proximity-search mechanism. We will create a tool for the first phase of the cross referencing, which will take a list of objects, with positions, search radii and constraints on the SDSS objects (star, galaxy or QSO, or a color or magnitude range), and for each of the external objects will create a list of pointers (references) into the SDSS catalog, with all the possible candidates.
2. There will be multiple candidates within the possible error-box. We need a mechanism to assign a probability for the match to each candidate, based upon our prior astrophysical knowledge, then to choose the most likely candidate. The colors and profile parameters will be extremely useful for such a purpose, although one can easily envisage cases where even the atlas images or the spectra play a role. Such an assignment can be in the form of a likelihood function, computed from the colors and from the properties of the external object itself (correlation of IR fluxes with our i' band, etc.). One can also envisage a Bayesian classifier. This tool has to be created for every external catalog separately; we would provide a template.
3. Once these two steps have been performed, the results must be verified, then the XID objects can be checked into the Master Science Archive. This involves an update of the schema (since XID objects with possibly new properties will have to be created), the check-in of the new objects into the XID segment of the Archive, and creation of the appropriate bi-directional references back to the SDSS objects.
Cordova, F.A.-D. "MultiWaveLink: an interactive data base for the coordination of multiwavelength and multifacility observations" Adv. Space Res., 1993.
Friedman, J.H., Bentley, J.L. and Finkel, R.A., 1977, ACM Transactions on Mathematical Software, 3, 209.
Helou, G., Madore, B., Schmitz, M., Corwin, H.G., Jr., Wu, X., Bennett, J., Lague, C. 1992, "NASA/IPAC Extragalactic Database", in Morphology of Galaxies: Nature or Nurture?, 1992 Moriond Meeting.
Samet, H. 1990a. Applications of Spatial Data Structures, Addison-Wesley.
Samet, H. 1990b. The Design and Analysis of Spatial Data Structures, Addison-Wesley.
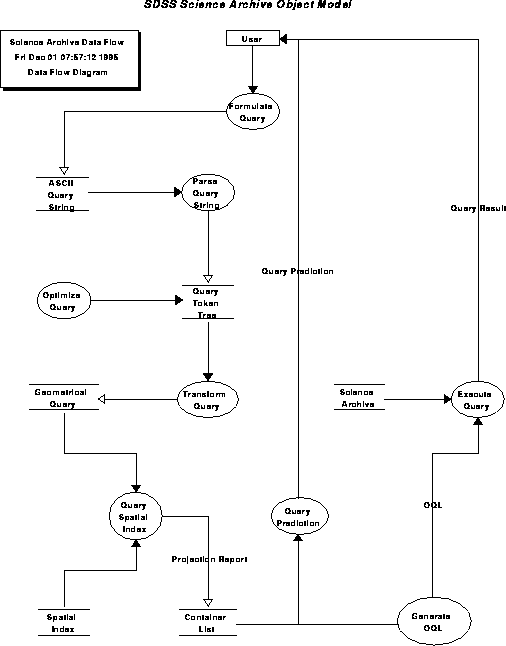
Object model for the science archive
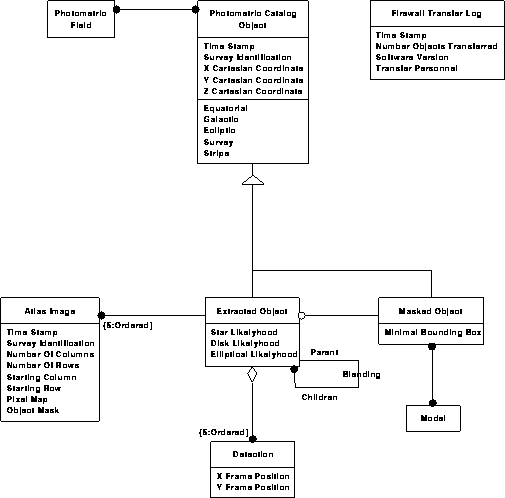
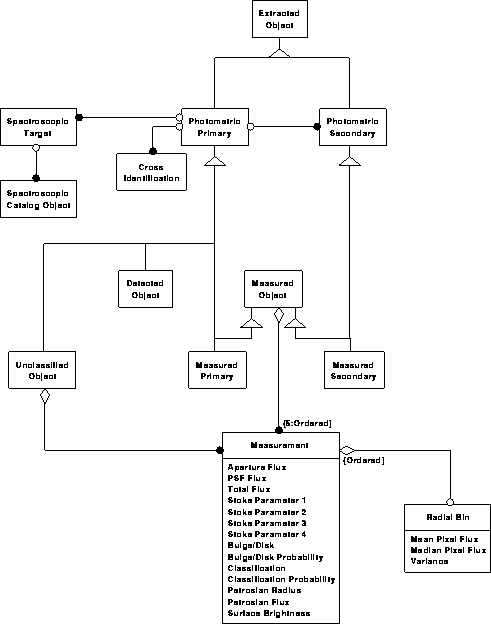
Photometric data model 1
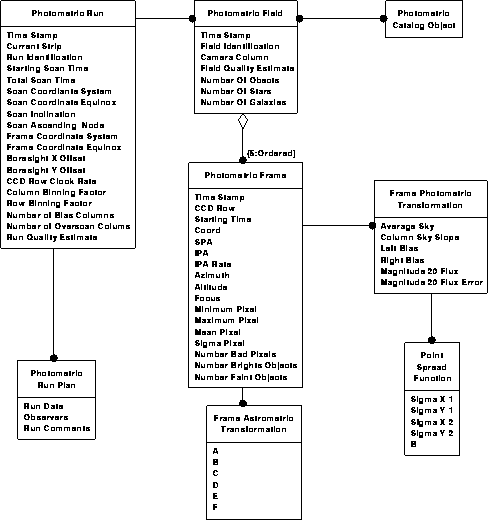
Photometric data model 2
Photometric data model 3
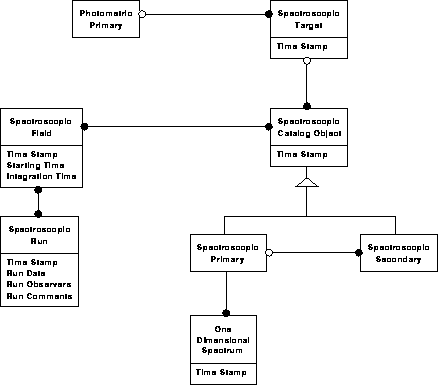
Photometric data model 4
Spectroscopic data model 1
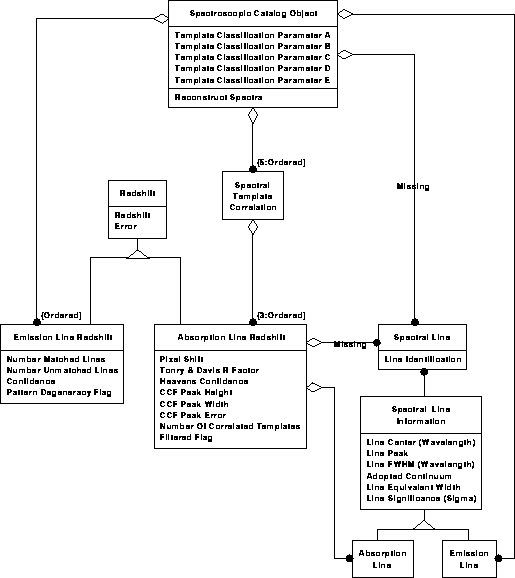
Spectroscopic data model 2
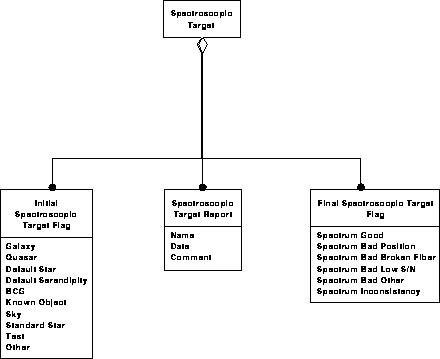
Spectroscopic data model 3